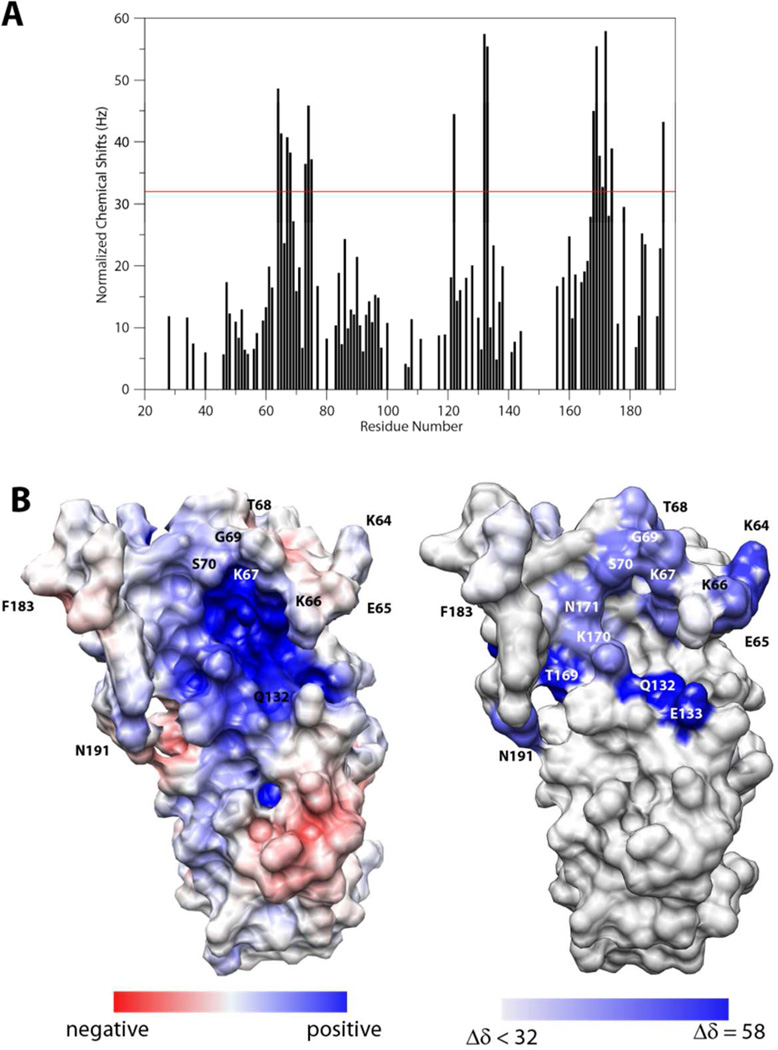
Figure 5.
A) Normalized chemical shift perturbations to backbone amide nitrogen and proton by heparin dp10. The red line represents the value of perturbation 1.5 standard deviations higher than the average. B) Comparison of electrostatic potential map of DBPA (left) and heparin perturbation map of DBPA. The DBPA perturbation mapped is colored according to the chemical shift perturbation values shown in A. The most perturbed residues are shown in deep blue.

