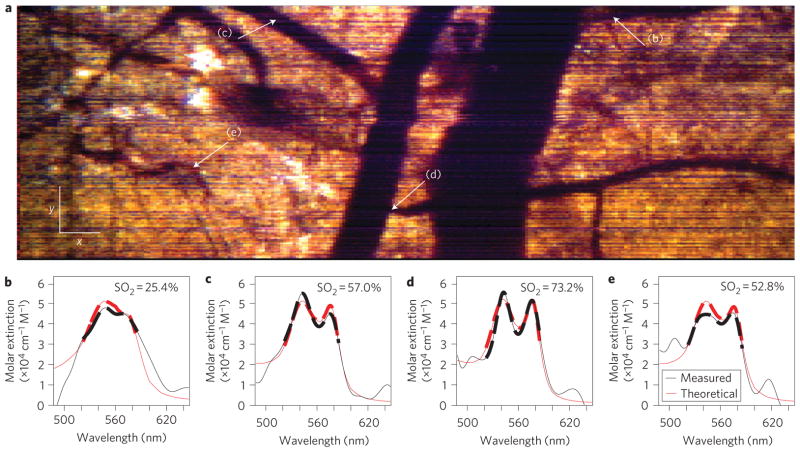
Figure 3. En face (x–y) image using endogenous contrast, and spectral profiles.
a, En face METRiCS OCT image with arrows indicating points where the spectra are quantified. White x and y scale bars, 100 μm. b–e, Spectral profiles from points (b)–(e) in a. Measured spectral profiles (black) are superposed with the theoretical haemoglobin molar extinction coefficients (red). The dashed portion of the curves outlines the region used to determine SO2 levels. All spectra were selected from depths immediately below each corresponding vessel.

