
Figure 4.
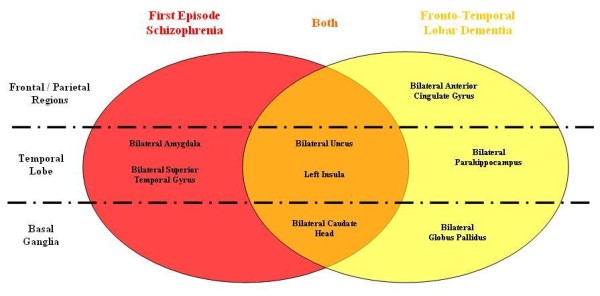
Venn diagram to summarise the distinct and overlapping regions of gray matter deficits found in FES and FTLD.
Official websites use .gov
A
.gov website belongs to an official
government organization in the United States.
Secure .gov websites use HTTPS
A lock (
) or https:// means you've safely
connected to the .gov website. Share sensitive
information only on official, secure websites.
Venn diagram to summarise the distinct and overlapping regions of gray matter deficits found in FES and FTLD.