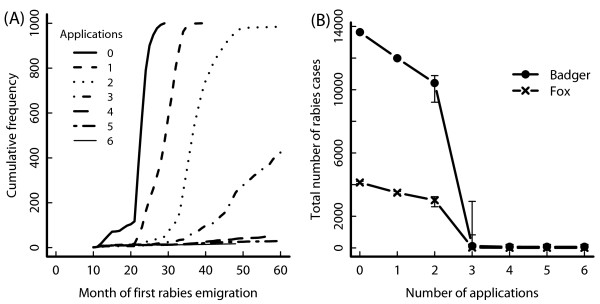
Figure 4.
Disease dynamics of a rabies outbreak with different control applications. Disease dynamics in high badger density (South West England) in a 38 km x 38 km area over 5 years (rabies starts in month 9); control: 70% fox vaccination, 20% badger vaccination and 40% badger culling within 9 km radius; Results from 1000 simulation repetitions; (A) Number of simulation runs in which a rabid animal has already left the simulated area by the month indicated on the x-axis; Different line types indicate the number of repeated applications at two monthly intervals; (B) Median and 25% quantiles (error bars) of the accumulated number of rabid animals in the simulated area over the 5 years.

