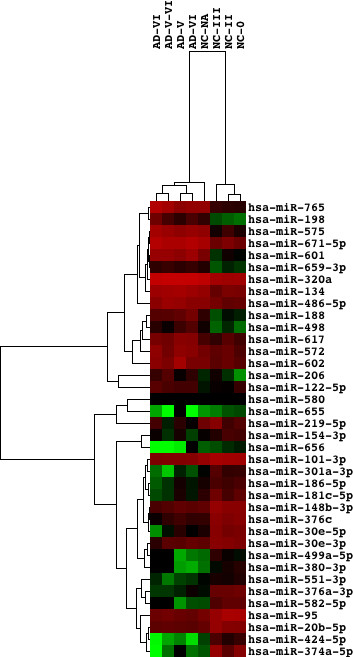
Figure 7.

Differentially expressed microRNAs separate the cluster of AD brains from normal controls. We studied the dataset GSE16759 that contains miRNA expression profiling of the parietal cortex of AD patients (n = 4) and age-matched normal controls (NC) (n = 4). The Braak staging for AD pathology ranking from 0 to VI is shown in individual cases. Hierarchical clustering analysis of the set of 16 upregulated and 22 downregulated miRNAs in AD versus NC separated the cluster of AD samples from the cluster of NC, except for one NC sample classified as an intermediate between AD and NC groups. Hierarchical clustering analysis was performed by using Cluster 3.0 and TreeView 1.1.5r2.
