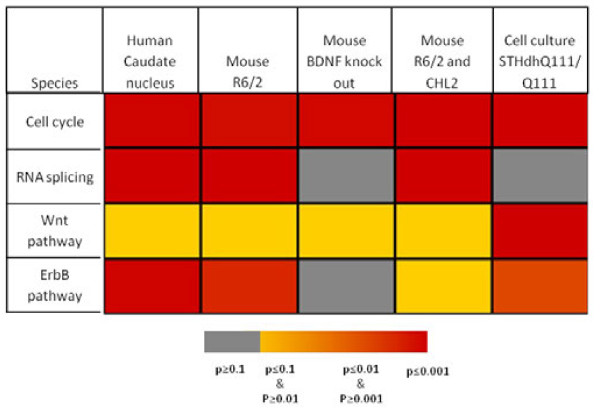
Figure 4.
Significance of enrichment in differentially expressed genes for human HD samples and disease models. The heat-map depicts the significance of enrichment in differentially expressed genes for GO process cell cycle and RNA splicing, as well as for the KEGG Wnt and ErbB pathway. P-values were derived by Fisher’s exact test.

