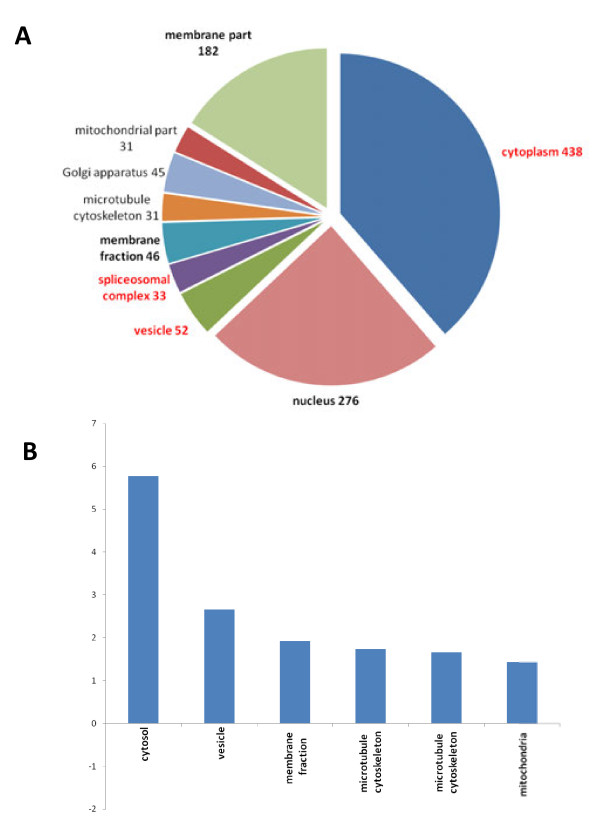
Figure 5.
Distribution of HD-relevant genes across cellular components. A) The pie-chart shows the distribution and the number of HD-relevant gene products allocated to GO Slim categories for cellular components. GO terms that are significant (FDR ≤ 0.01) are set in bold and terms with an odds ratio ≥ 2.0 are set in red. Note that the cellular component categories are not exclusive, i.e., a gene can be assigned to several categories. B) The plot displays odd ratios for enrichment of selected cellular components.

