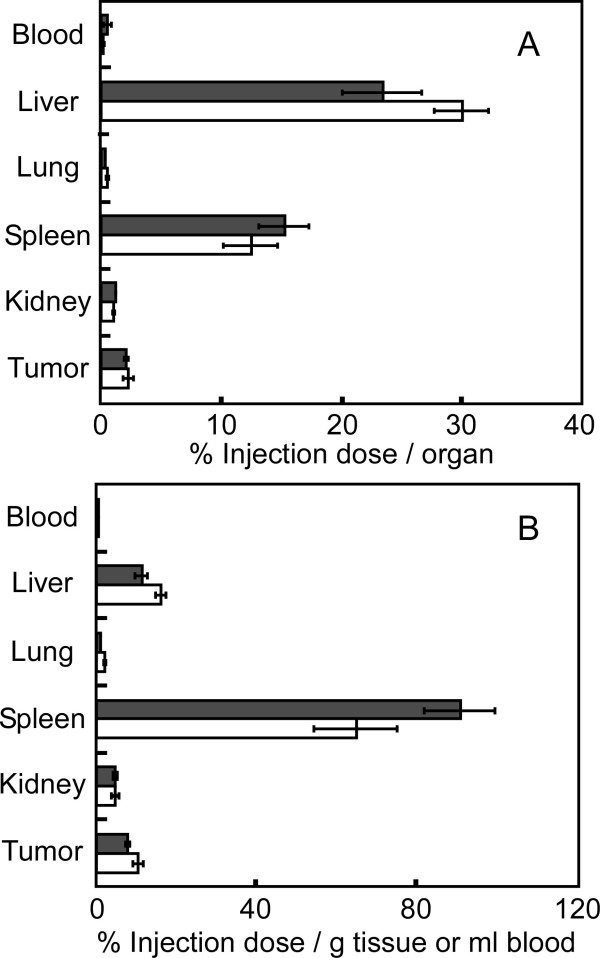
Figure 4.
Biodistribution of PEG-modified gold nanorods in tumor-bearing mice. The biodistribution of PEG-modified gold nanorods at 72 h after intravenous injection was compared. Closed bars and open bars indicate the biodistribution of PEG-modified gold nanorods at aspect ratios of 5.0 (n = 5) and 1.7 (n = 4), respectively. (A) The percentage of injected dose per organ and (B) percentage of injected dose per gram of tissue or milliliter of blood, respectively. Bars are the standard error from the mean.

