Figure 4.

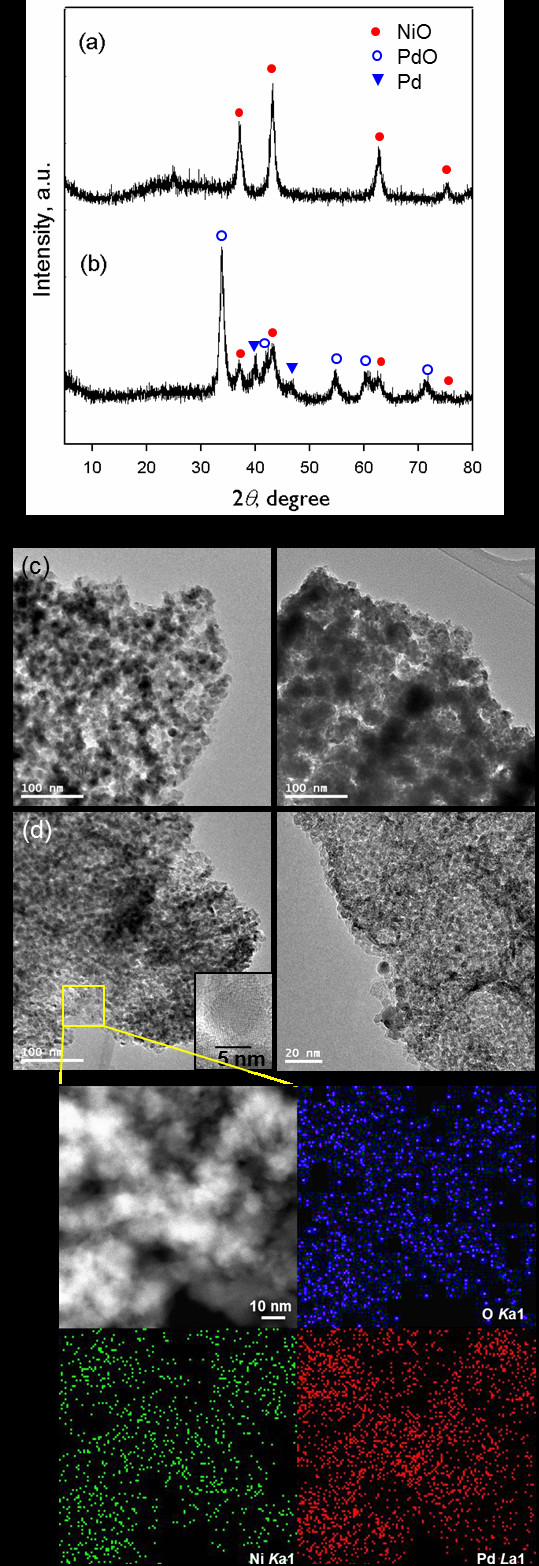
XRD patterns, TEM images, and EDS mapping. XRD patterns and TEM images of (a, c) ra-MOF and (b, d) Pd@ra-MOF, respectively, after CO oxidation reactions. (e) EDS mapping of Pd@ra-MOF after CO oxidation reaction.

XRD patterns, TEM images, and EDS mapping. XRD patterns and TEM images of (a, c) ra-MOF and (b, d) Pd@ra-MOF, respectively, after CO oxidation reactions. (e) EDS mapping of Pd@ra-MOF after CO oxidation reaction.