
Figure 4.
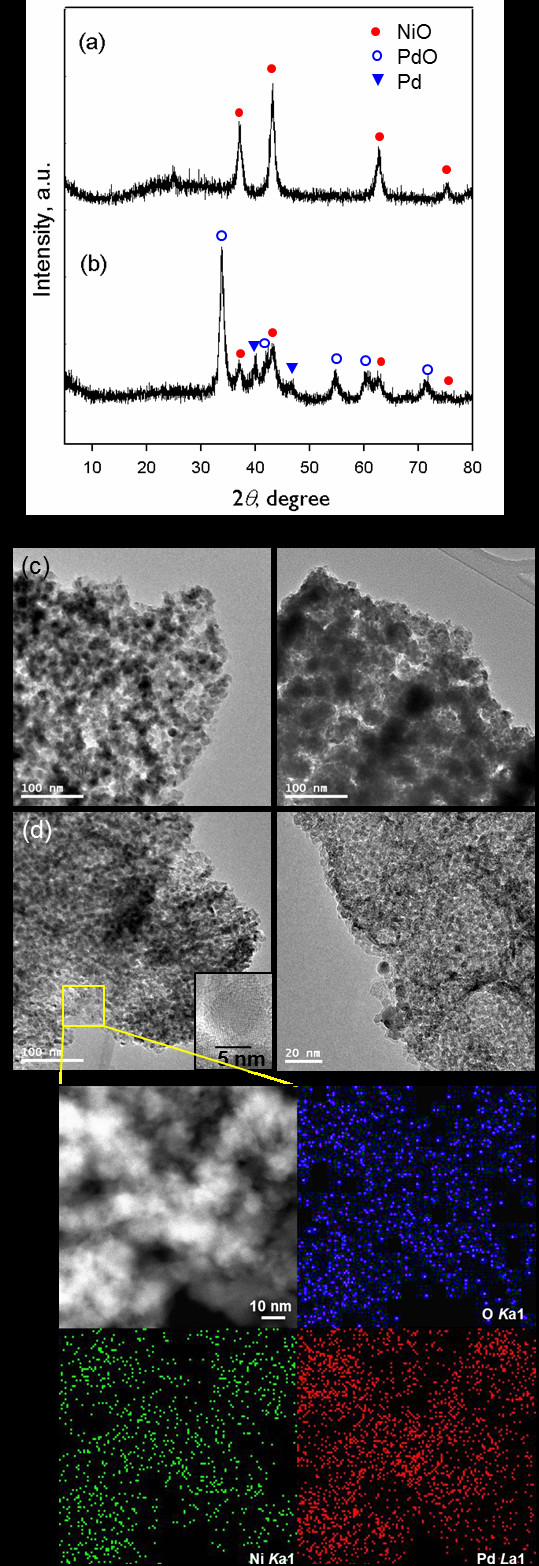
XRD patterns, TEM images, and EDS mapping. XRD patterns and TEM images of (a, c) ra-MOF and (b, d) Pd@ra-MOF, respectively, after CO oxidation reactions. (e) EDS mapping of Pd@ra-MOF after CO oxidation reaction.
Official websites use .gov
A
.gov website belongs to an official
government organization in the United States.
Secure .gov websites use HTTPS
A lock (
) or https:// means you've safely
connected to the .gov website. Share sensitive
information only on official, secure websites.
XRD patterns, TEM images, and EDS mapping. XRD patterns and TEM images of (a, c) ra-MOF and (b, d) Pd@ra-MOF, respectively, after CO oxidation reactions. (e) EDS mapping of Pd@ra-MOF after CO oxidation reaction.