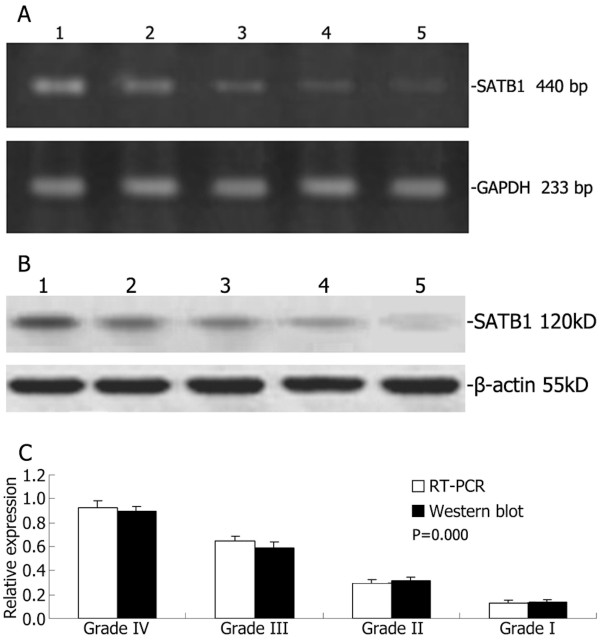
Figure 2.
RT-PCR and Western blotting analysis of SATB1 expression in human glioma and normal brain tissue. Representative images of SATB1 RT-PCR (A) and Western blot (B). Lane 1, glioma with WHO grade IV; lane 2, glioma with WHO grade III; lane 3, glioma with WHO grade II; lane 4, glioma with WHO grade I; lane 5, normal brain tissue. (C) The ratio of SATB1 mRNA/protein expression to glyceraldehyde 3-phosphate dehydrogenase (GADPH)/-actin showing increased SATB1 mRNA/protein expression in high grade gliomas compared to low grade gliomas.

