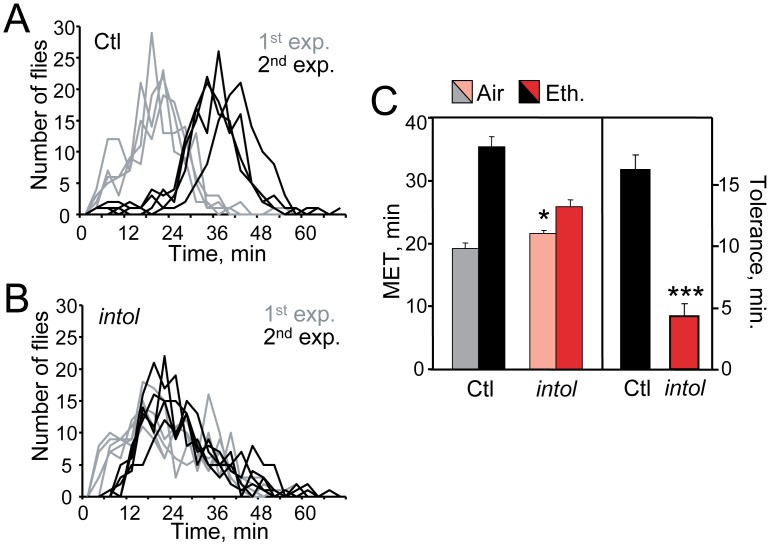
Figure 1. The intol mutant exhibits drastically reduced ethanol tolerance development.
(A) Normal ethanol tolerance is displayed by control flies (parental strain, Ctl). Ethanol-naïve control flies eluted from the inebriometer with a mean elution time (MET) of 19.2±0.9 min (1st exposure, gray), while the elution profiles of Ctl flies that had been exposed to ethanol 4 hr earlier, were strongly shifted to the right (2nd exp., black; MET = 35.4±1.6 min). (B) Ethanol pre-exposure under otherwise identical conditions did not produce a similar increase in resistance in the intol mutant (1st exp., gray, MET = 21.6±0.5 min; 2nd exp., black, MET = 25.9±1.1 min). Inebriometer elution profiles for Ctl (A) and intol mutant flies (B) are shown; n = 4 (Ctl) or 5 (intol). Here and elsewhere, error bars represent standard error of the mean (SEM), and n refers to the number of samples, not the number of flies. (C) MET and tolerance values for Ctl and intol flies for inebriometer data represented in panels (A) and (B). The intol mutant displayed strongly reduced tolerance of 4.3±1.0 min vs. 16.2±1.2 min for Ctl flies (***, [F(1,7) = 55.53, p<0.001], one-way ANOVA). Additionally, ethanol resistance in the intol mutant showed a modest but significant increase, with MET = 21.6±0.5 min vs. 19.2±0.9 min for Ctl flies (*, [F(1,7) = 6.511, p<0.05]).

