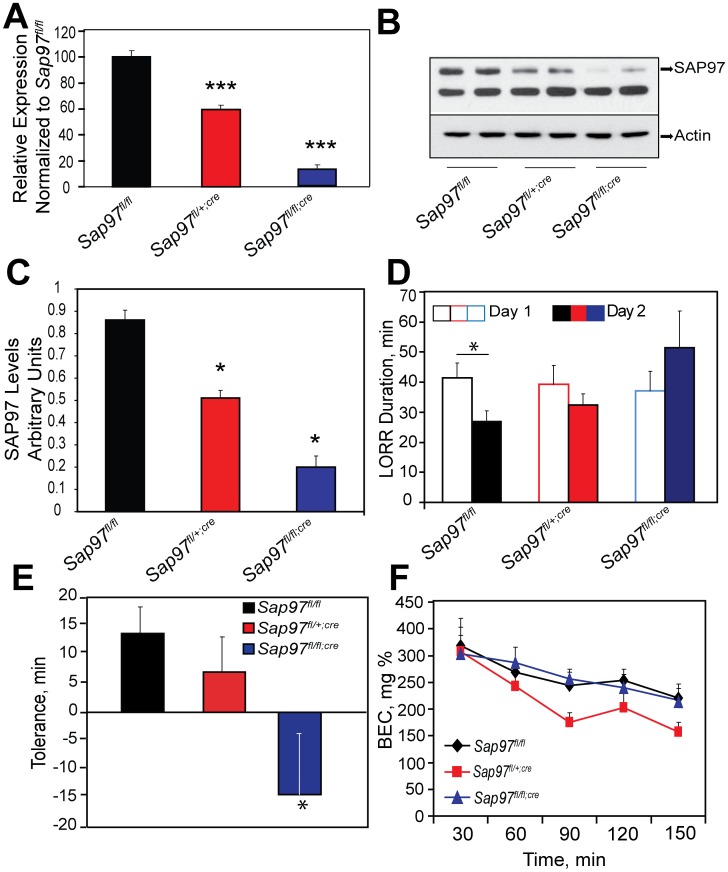
Figure 8. Mice with reduced SAP97 levels do not develop rapid tolerance to ethanol.
(A) Sap97 mRNA levels were compared between Sap97fl/fl, Sap97fl/+;cre and Sap97fl/fl;cre mice 3–4 weeks after TM injection. Male and female mice were used in this experiment. One Way ANOVA revealed a significant difference in Sap97 levels between the three genotypes [F[2], [15] = 127.326, p<0.001]. Bonferroni post hoc test revealed that Sap97 mRNA levels were significantly reduced to 60% in Sap97fl/+;cre mice (***, p<0.001) and to 10% in Sap97fl/fl;cre mice in comparison to Sap97fl/fl mice (***, p<0.001). n = 9 (Sap97fl/fl), 4 (Sap97fl/+;cre), and 5 (Sap97fl/fl;cre). (B) Representative western blot showing reduction in SAP97 protein levels in whole brain protein extracts of Sap97fl/fl, Sap97fl/+;cre and Sap97fl/fl;cre mice 3–4 weeks after TM injection. (C) Quantification of results in B. One-Way ANOVA revealed a significant main effect of genotype [F[2,9] = 55.931, p<0.001]. Bonferroni posthoc test revealed that Sap97fl/+;cre and Sap97fl/fl;cre mice expressed significantly less SAP97 in comparison to Sap97fl/fl mice (***, p<0.001). n = 4/genotype. D) Ethanol-induced LORR was measured in Sap97fl/fl, Sap97fl/+;cre and Sap97fl/fl;cre mice on two consecutive days. Two-Way repeated measures (RM) ANOVA detected a significant genotype×day interaction [F[2], [18] = 4.369, p = 0.029]. Bonferroni posthoc test revealed that the duration of LORR was significantly lower on Day 2 in comparison to Day 1 in Sap97fl/fl (*, p<0.05), but not Sap97fl/+;cre or Sap97fl/fl;cre mice, n = 13 (Sap97fl/fl ), 12 (Sap97fl/+;cre), and 10 (Sap97fl/fl;cre). (E) Tolerance scores, obtained by subtracting duration of LORR on Day 1 from Day 2, are shown. One–Way ANOVA revealed a significant effect of genotype on the development of tolerance [F(2,32) = 4.072, p<0.05]. Bonferroni post hoc test suggested that Sap97fl/fl mice developed significantly more tolerance to ethanol’s sedative hypnotic effects than Sap97fl/fl;cre mice, (*, p<0.05). (F) Ethanol metabolism curves are shown for the three genotypes. Two-Way RM ANOVA revealed a significant main effect of time [F [4,105] = 19.870, p<0.001] but no genotype [F [2,105] = 1.470, P>0.05] or time×genotype interaction [F [8,105] = 0.916, p>0.05] suggesting that all three genotypes metabolized ethanol at the same rate. n = 10 for (Sap97fl/fl, Sap97fl/fl;cre), n = 9 (Sap97fl/+;cre).

