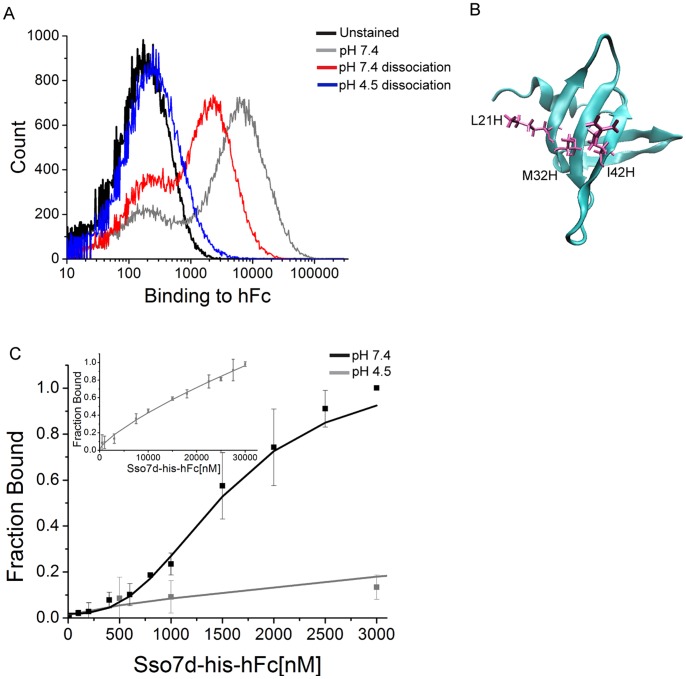
Figure 2. Characterization of pH sensitivity for Sso7d-his-hFc.
(A) End-point assay to determine pH sensitivity for Sso7d-his-hFc. Yeast cells displaying Sso7d-his-hFc were incubated with 100 nM hFc-biotin and the yeast-hFc complexes were dissociated in buffers at pH 7.4 and pH 4.5. Undissociated hFc remaining on yeast surface was detected using strep-PE. A cell sample where no dissociation step was carried out after hFc labeling at pH 7.4, and unstained cells were used as controls. (B) Histidine scanning analysis of Sso7d-hFc. Three out of ten histidine substitutions (L21H, M32H and I42H) lead to complete loss of binding to hFc, and therefore are involved in binding to hFc. Structure of the Sso7d scaffold with these residues in licorice representation is shown. This image was generated using Visual Molecular Dynamics (VMD) software. (C) ELISA for determination of the apparent KD of binding between hFc and Sso7d-his-hFc, at pH 7.4 and pH 4.5. hIgG (2 µg/ml) was immobilized on a microtiter plate and incubated with twelve different concentrations of soluble Sso7d-his-hFc. hIgG-bound Sso7d-his-hFc was detected using an anti-his-alkaline phosphatase conjugated antibody, and p-nitrophenyl phosphate as the substrate. Error bars indicate the standard deviation of absorbance measurements at 405 nm. The inset shows binding curve at pH 4.5 over a wider range of Sso7d-his-hFc concentration.

