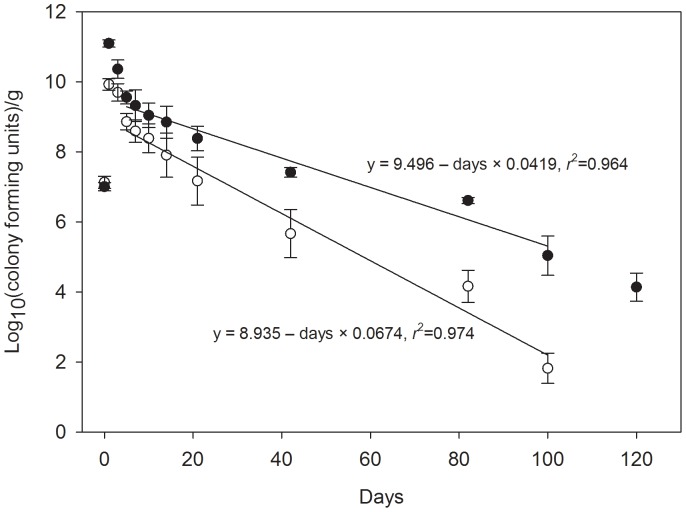
Figure 3. Ceftiofur metabolites select for ceftiofur resistant E. coli in soil.
Mean colony forming units for cefR E. coli after incubation at 23°C in a sandy soil and urine matrix (open circles, 0 ppm CFM; closed circles 50 ppm CFM). Regression lines between days 5 and 100 were significantly different (P<0.008). Bars = s.e.m.

