Figure 8.
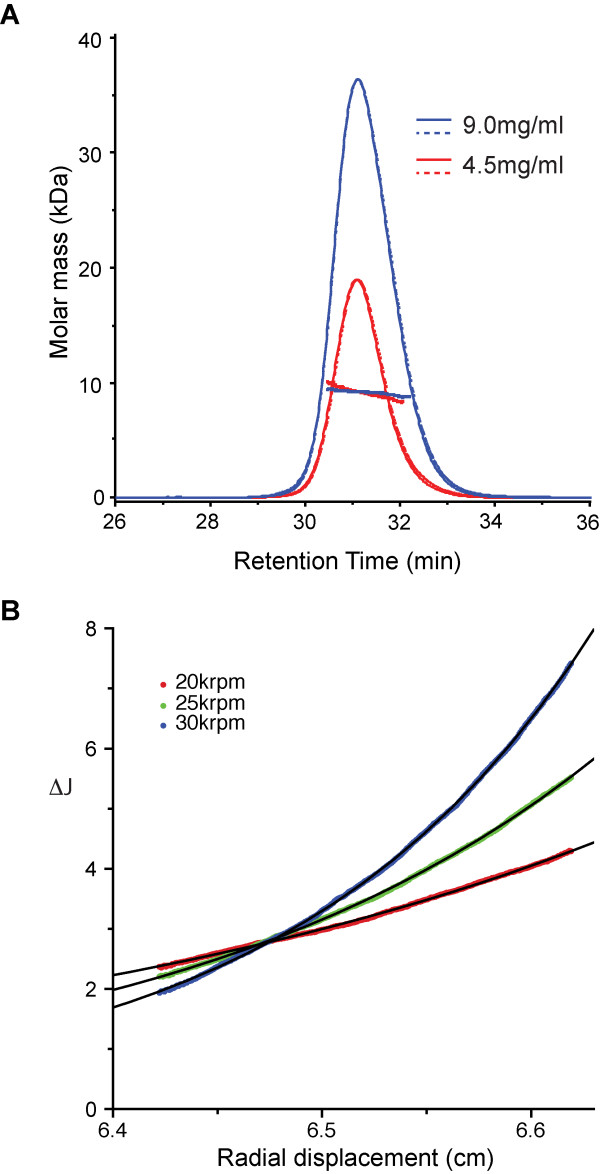
Biophysical analysis of purified p12 protein. A) SEC-MALLS analysis of p12. Scattered light intensity (solid line) and differential refractive index (dashed line) are plotted against retention time. Traces from p12 samples applied to a G75 (10/30) size exclusion column at 9.0 mg/ml (blue) and 4.5 mg/ml (red) are shown. The molar mass distributions, plotted as points, were determined throughout each peak as described in the text. B) Sedimentation equilibrium analysis of p12. A typical multispeed sedimentation equilibrium profile obtained from interference data collected on p12 at 100 μM is shown. The data were collected at 20, 25 and 30 krpm (red, green and blue points respectively). A global fit single-species ideal solution model incorporating data from all speeds and concentrations (black lines) gives a p12 molar mass of 9.3kD.

