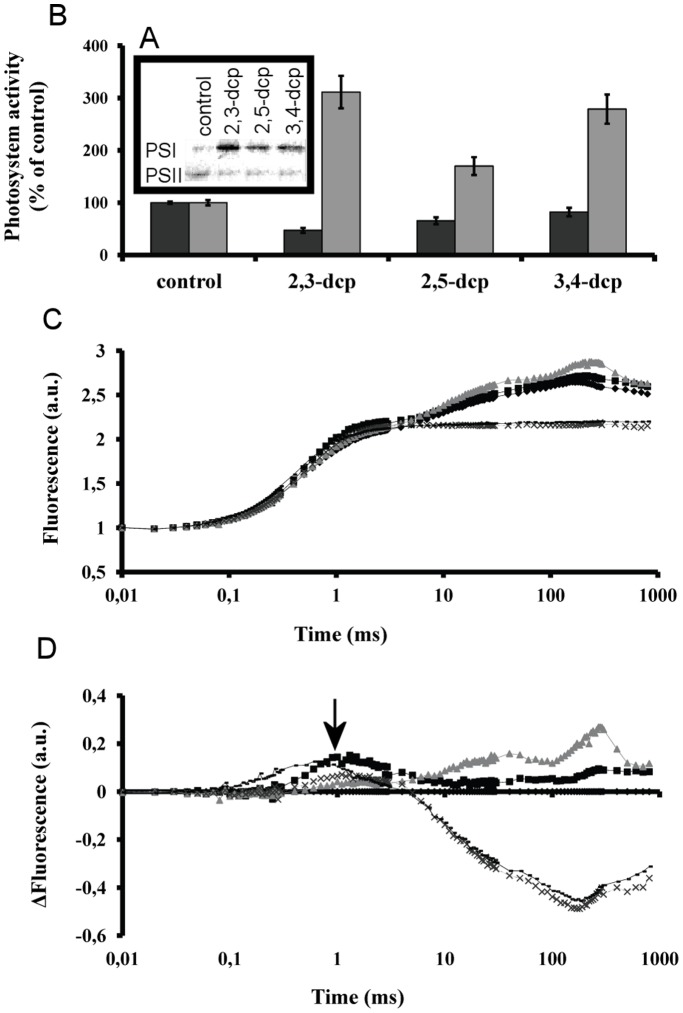
Figure 4. Influence of m-dcps on photosynthetic electron transport chain of mixotrophic Scenedesmus obliquus cultures.
(A) Western blot analysis of immunoreactive D1 and PSaA proteins in the fifth incubation day with m-dcps (the same pattern observed in the second incubation day with m-dcps). (B) PSII (dark grey) and PSI (light grey) activities from isolated thylakoids treated with m-dcps in reduced form for 1 min. (C) Short term in vivo effects of m-dcps in primary photochemistry. Fluorescence induction curves of algal cells incubated for 5 min in the dark with m-dcps or DCMU recorded at room temperature with a saturating red light pulse of 3000 µmol m−2 s−1. (black diamond) control, (black square) 2,3-dcp, (grey triangle) 2,5-dcp, (discontinuous line) 3,4-dcp and (continuous line) DCMU. (D) Difference fluorescence induction curves for the samples of Figure 4C by subtracting control values at each time point from treated samples. (black diamond) control, (black square) 2,3-dcp, (grey triangle) 2,5-dcp and (discontinuous line) 3,4-dcp and (continuous line) DCMU. The black arrow indicates the phase of inhibition of electron transport at approximately the first ms of illumination.

