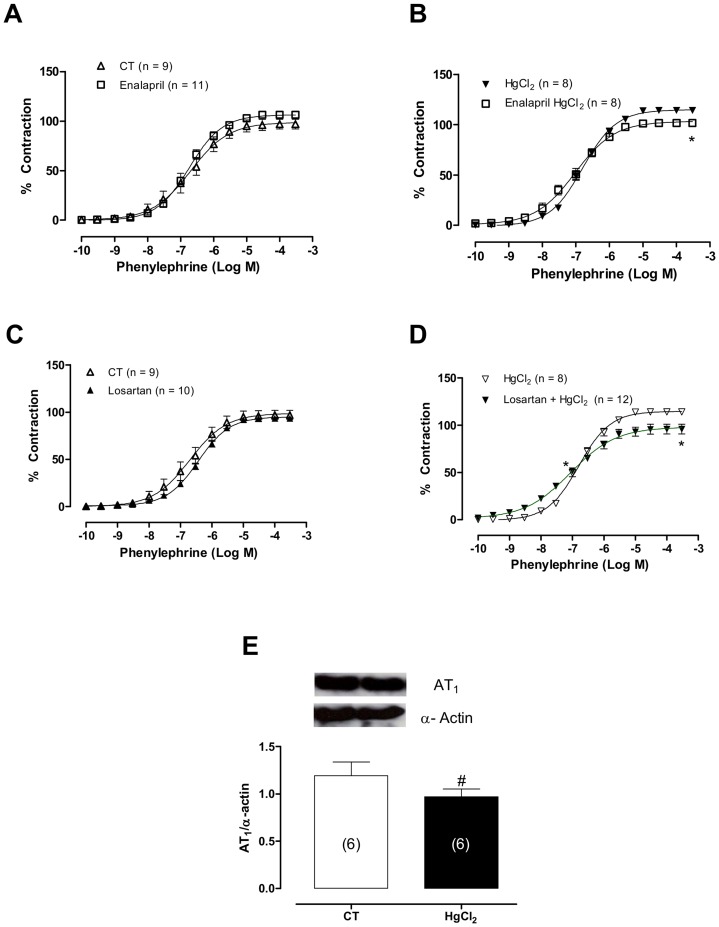
Figure 6. (A,B) The effects of enalapril (10 µM) and (C,D) losartan (10 µM) on the concentration-response curves for phenylephrine and (E) densitometric analysis of the western blot for AT1 in aortic rings in control (CT) conditions or HgCl2.
Results (mean±SEM) are expressed as a percentage of the response to 75 mmol/l KCl. *P<0.05 by ANOVA. (E) Densitometric analysis of the western blot for angiotensin receptor 1 (AT1) protein expression in aortic rings cultured in the absence (CT) of HgCl2 and after acute incubation with HgCl2. *P<0.05 by Student’s t-test. Number of animals used in parentheses. Representative blots are also shown.

