
Figure 2 .
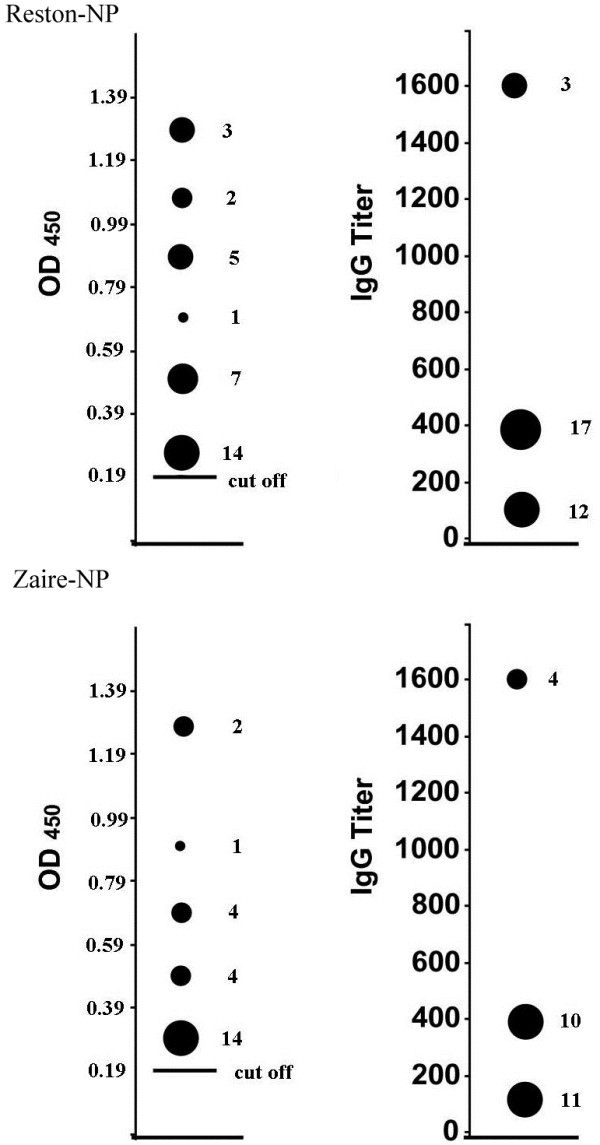
Distribution of OD450readings and antibody titers among different positive bat sera. The left panel shows the corrected OD450 readings at a serum dilution of 1:100. The right panel displays the antibody titers at an OD450 reading equal or greater than 0.19 (> 2-fold – ve sera). The number of sera at each OD450 or titer reading is shown to the right of the proportionally sized dots.