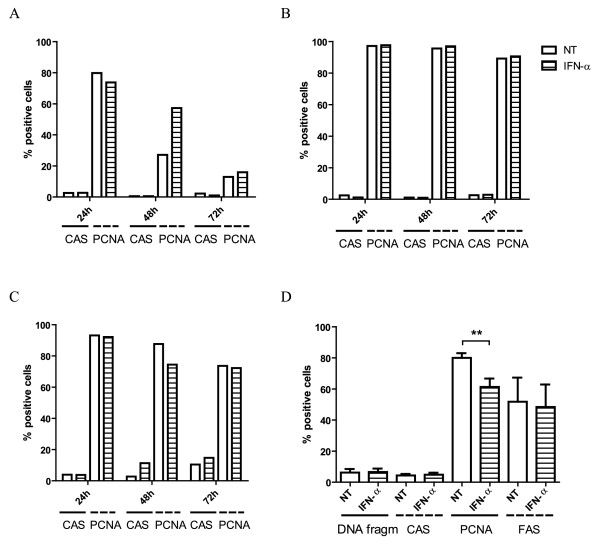
Figure 1.
Flow cytometric analysis of cell death- and cell proliferation-associated markers of HTLV-1-infected cell lines. HTLV-1-infected CD4+ T cell lines, (A) C8166, (B) MT-2 and (C) MT-4 were treated for 24, 48 and 72 hours with no treatment (NT) or IFN-α, illustrated here for a fixed concentration of 1000 IU/ml. The percentage of active-caspase 3-positive cells (CAS) and proliferating cell nuclear antigen-positive cells (PCNA) were determined by flow cytometry and shown in the y-axis. The time points of treatment together with the treatment conditions are shown in the x-axis. (D) MT-4 cells were treated for 48 hours with no treatment (NT) or IFN-α (1000 IU/ml) in six independent experiments. Flow cytometric quantification of cells with DNA fragmentation (Hoechst 33342-positive cells), active-caspase 3-positive cells (CAS), proliferating cell nuclear antigen-positive cells (PCNA) and Fas receptor-positive cells (FAS) are shown in the y-axis, whereas the treatment conditions are shown in the x-axis. Parametric t-tests were used with p-values indicated by asterisks (* < 0.05, ** < 0.01 and *** < 0.001).

