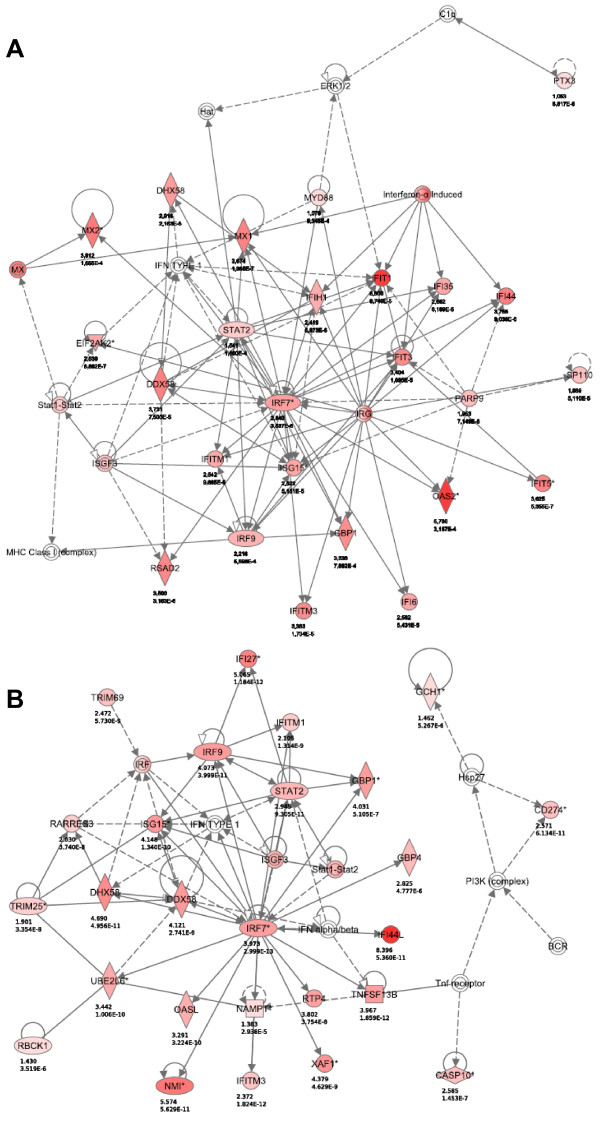
Figure 5.
STAT1/STAT2 signaling pathways predominate following IFN-α treatment in MT-2 and MT-4 cells. Ingenuity Pathway Analysis (IPA) was performed on genes regulated by IFN-α treatment (6 h) in MT-2 (A) and MT-4 cells (B). The red colour indicates up-regulation with the intensity indicating the degree of the gene transcription change. The log2 fold-change values and p-values are indicated below each molecule. Full lines represent direct interactions, while dashed lines indirect interactions. Network shapes are as in Figure 3.

