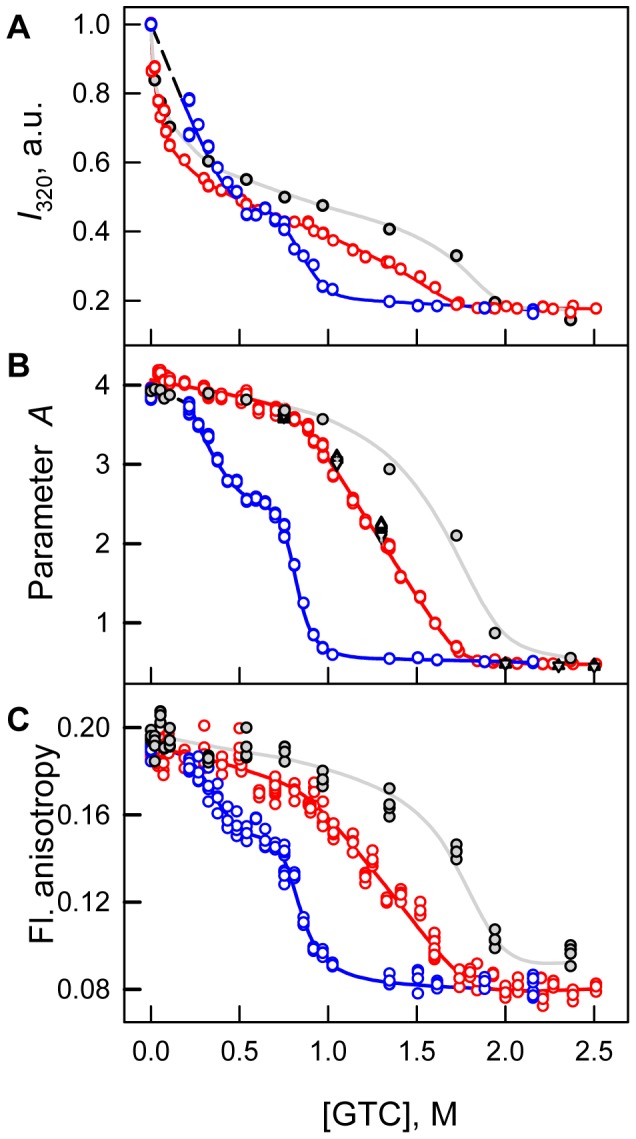
Figure 4. Conformational changes of sfGFP induced by GTC.

(A) Changes in fluorescence intensity recorded at 320 nm. (B) Changes of parameter A. (C) Changes of fluorescence anisotropy at emission wavelength of 365 nm.  . Red circles and line indicate unfolding and blue circles and line represent refolding. Measurements were performed after 24 h incubation of native or denatured protein in the GTC presence. The values of parameter A of sfGFP measured after incubation of native protein in the GTC presence during 1 h (gray circles and line), 45 h (black triangles), 69 h (reversed gray triangles) and 94 h (gray crosses) are also indicated.
