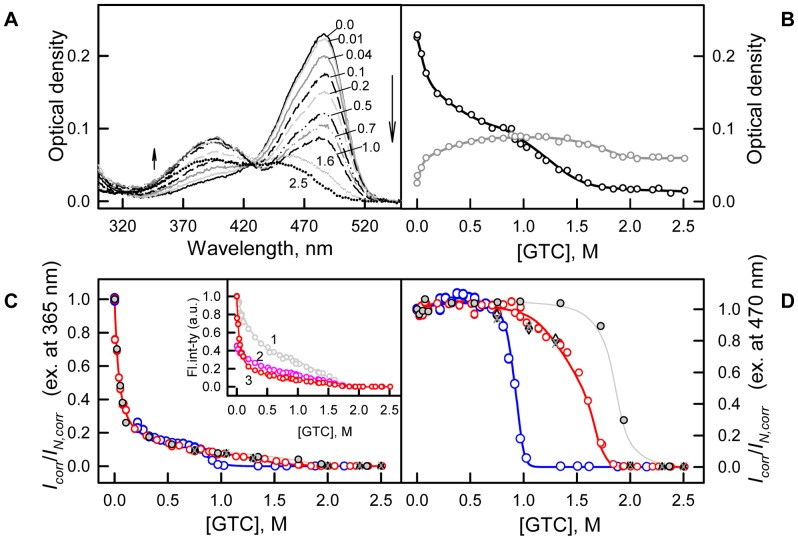
Figure 5. Conformational changes of sfGFP induced by GTC.
(A) Changes of visible absorption spectra at increasing of GTC concentration as shown by arrows. Numbers at the curves indicate the denaturant concentration. (B) Changes of absorbance at 390 nm (gray circles and line) and 490 nm (black circles and line). (C and D) Changes of corrected fluorescence intensity of green chromophore at two wavelengths of excitation of 365 nm and 470 nm corrected to the change of chromophore absorption spectra. Red circles and line indicate unfolding, whereas blue circles and line represent refolding. Measurements were performed after 24 h incubation of native or denatured protein in the GTC presence. The values of chromophore intensity of sfGFP measured after incubation of native protein in the GTC presence during 1 h (gray circles and line), 45 h (black triangles), 69 h (reversed gray triangles) and 94 h (gray crosses) are also indicated. Inset to panel C: experimentally recorded (curve 1, gray), corrected to total density of solution as I/W, where  (curve 2, pink), and corrected to the change of chromophore absorption spectra (see, panel C) on GTC concentration (curve 3, red) [47], [48], [49].

