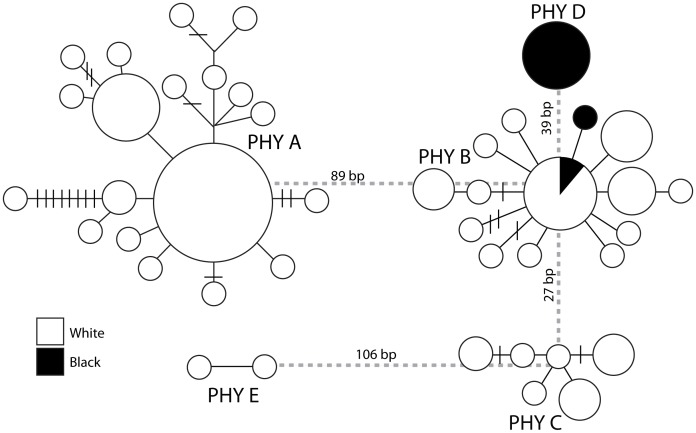
Figure 2. Statistical parsimony network for the Centromochlus existimatus species complex based on the mitochondrial haplotypes from ATPase 6 and 8.
Each circle denotes a unique haplotype and the area of the circle is proportional to its frequency. The shade of the circle represents the water colour of the sample site; white or black.

