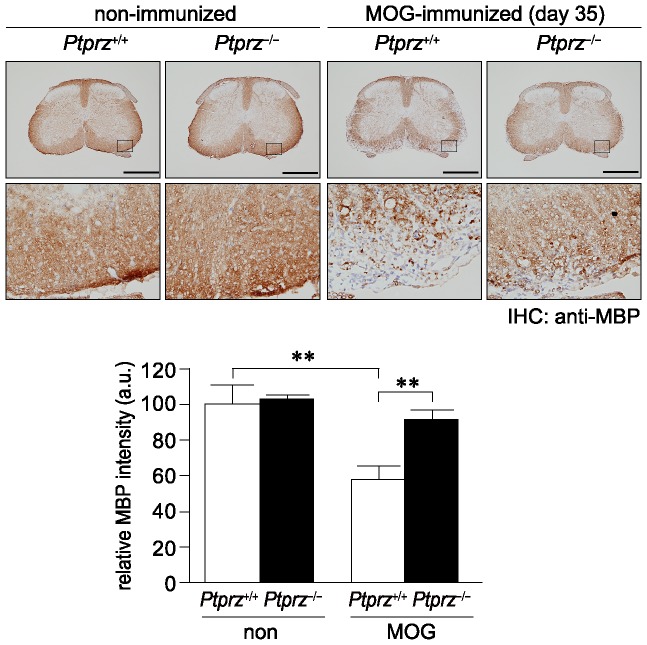
Figure 10. Reduced MBP loss in Ptprz-deficient mice after EAE induction.
Anti-MBP staining of the spinal cord sections from wild-type and Ptprz-deficient mice 35 days after MOG immunization, or non-immunized control mice. The lower images are enlargements of the areas enclosed by squares in the upper images. Scale bars, 500 µm. The densitometric data for MBP signals are expressed as the relative change (fold-increase) compared with the non-immunized wild-type mice, and shown at the bottom. Data are the mean ± SEM (n = 6 for each group). **p<0.01 (Student's t-test). a.u., arbitrary unit.

