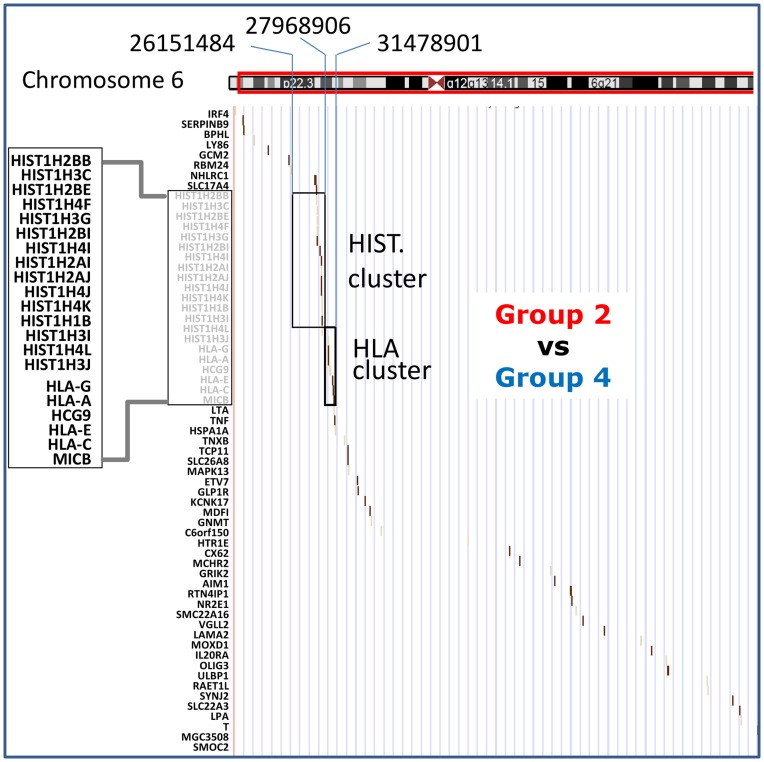
Figure 9. The region of chromosome 6p bearing genes methylated differentially between Group 2versus Group 4 cells.
Chr 6 is schematically represented on the top. Target genes with more than 20% gain of methylation are indicated by a small vertical bar as a function of their chromosomal location and their methylation: the darker is the bar higher is the gain of methylation. Note the accumulation of the targets genes in the cluster of histone- and HLA-coding genes.

