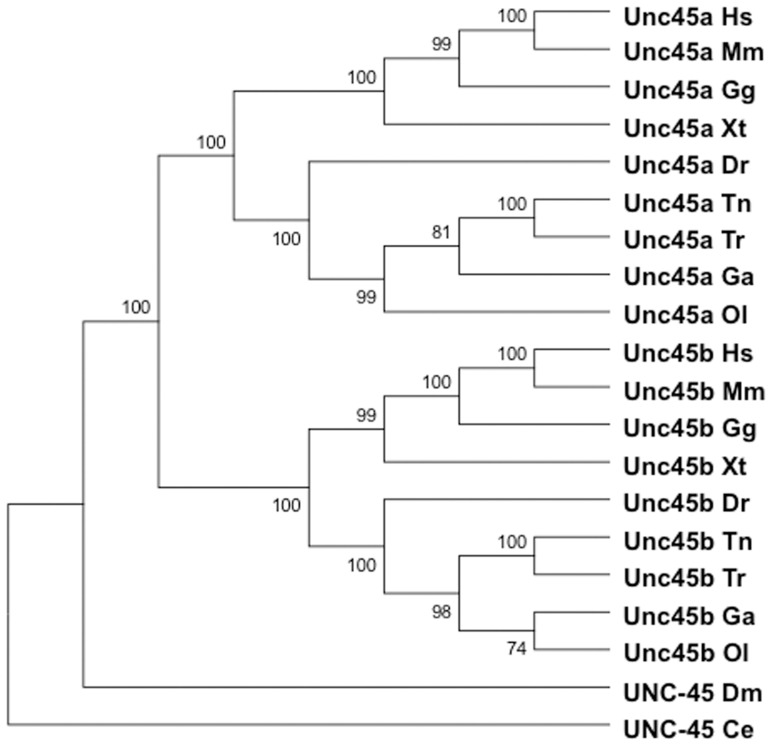
Figure 1. Phylogenetic analysis of Unc45 sequences.
Protein sequences were aligned using ClustalW2 and phylogenetic trees were generated by the Neighbour-Joining method with MEGA5. Bootstrap values for 1000 replicates are indicated to the right of the nodes. Ce, Caenorhabditis elegans; Dm, Drosophila melanogaster; Dr, Danio rerio; Ga, Gasterosteus aculeatus; Gg, Gallus gallus; Hs, Homo sapiens; Mm, Mus musculus; Ol, Oryzias latipes; Tn, Tetradon nigroviridis; Tr, Takifugu rubripes; Xt, Xenopus tropicalis. The Ensembl gene IDs of the genes used in generating the phylogenetic trees are listed in Table S1.

