
Figure 1. SMRs and 95% confidence intervals by years of cART and time updated CD4 cell count.
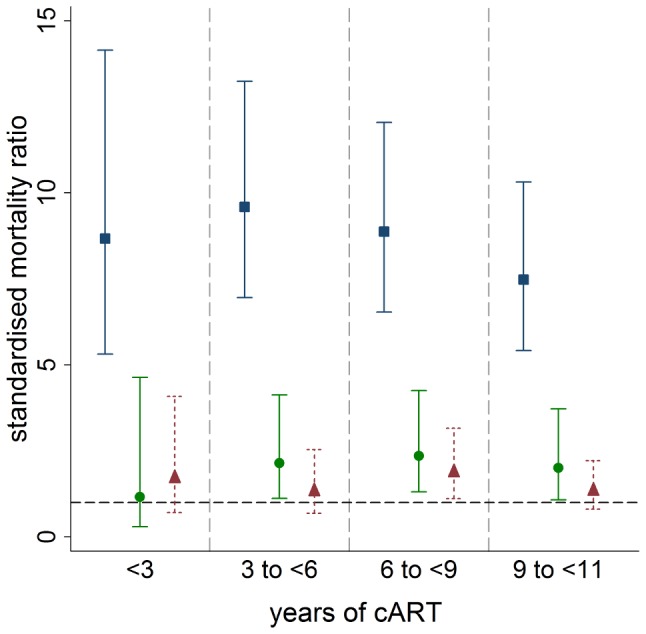
Blue/square markers represent patients with CD4<350 cells/µl. Green/round markers represent patients with CD4 from 350 to 499 cells/µl. Red/triangular markers represent patients with CD4≥500 cells/µl. Grey/horizontal dashed line represents SMR of 1.