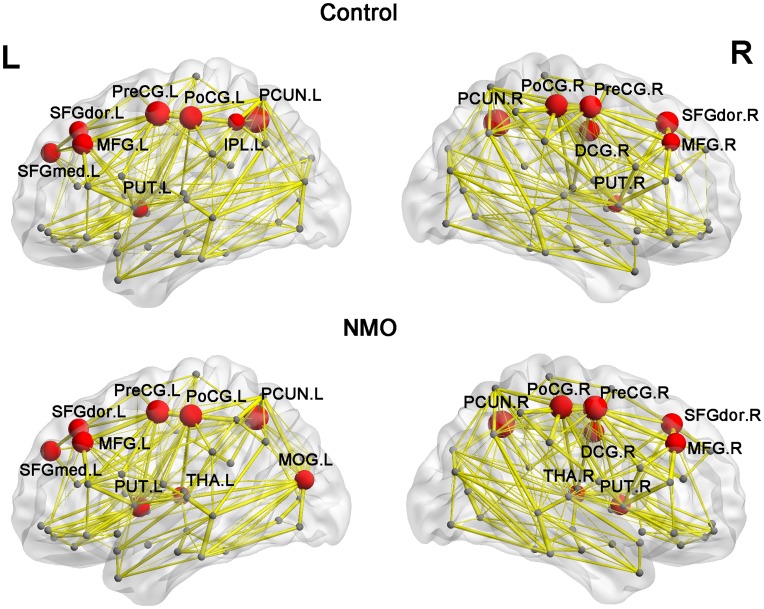
Figure 3. The hub region distributions of the WM structural networks in the control and NMO groups.
The hub nodes are shown in red with node sizes indicating their nodal efficiency values. The network shown here was constructed by averaging the WM connection matrices of each group and thresholded with the sparsity of 10%. The regions were mapped onto the cortical surface at the lateral view. The nodal regions are located according to their centroid stereotaxic coordinates. For the abbreviations of nodes, see Table 2.

