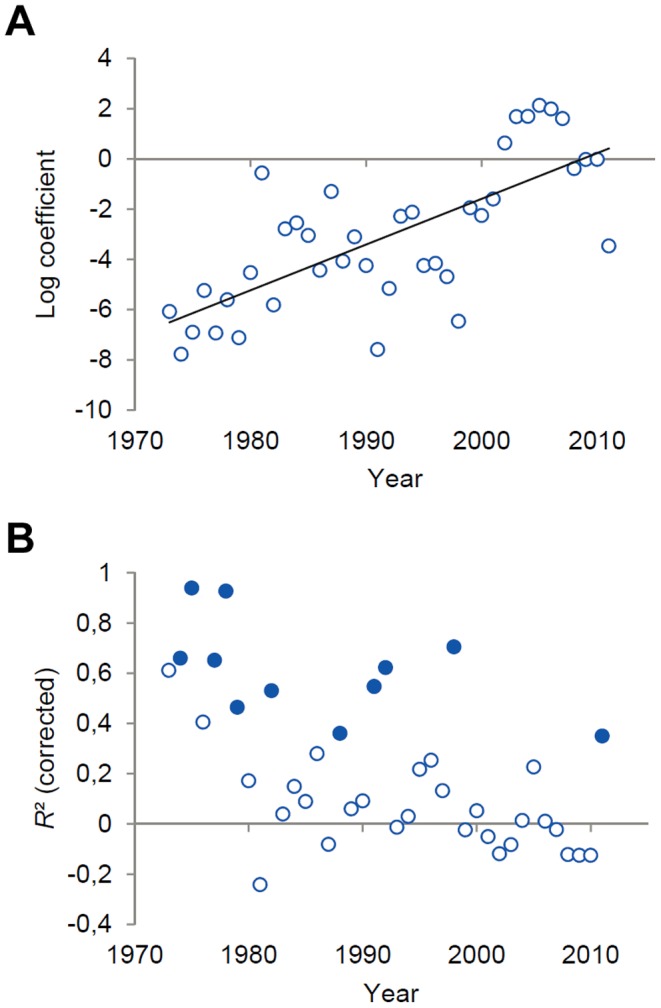
Figure 2. Results from logarithmic fittings of left-hander frequencies to ranking intervals.

(A) Coefficients obtained from the logarithmic fittings of left-hander frequencies to ranking intervals of top 500 players in year-end rankings. Note that for the years 1973 to 1976 and for 1981 only data of the top 250 to top 400 male players was available (see Table S2). Ranking intervals were considered if the number of players whose playing hand was known was larger than or equal to 20. Higher (lower) proportion of left-handed players with better ranking interval is reflected in negative (positive) coefficients. Coefficient data was fitted to a first-order polynomial with R 2 = .51. (B) Explained variance (corrected R 2) in left-hander frequencies by ranking interval across the period considered. Blue filled circles mark the years where the explained variance was significantly different from 0 (p<.05).
