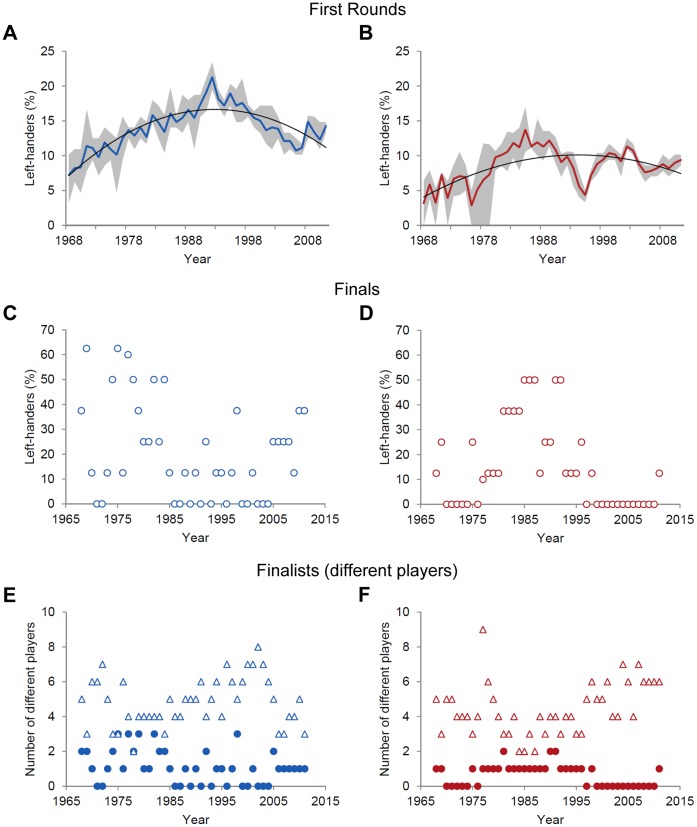
Figure 3. Left-handedness at Grand Slam tournaments (1968–2011).
Mean percentages of left-handed players in the first rounds of (A) men’s and (B) ladies’ singles competition (both fitted to second-order polynomials, men: R 2 = .76, ladies: R 2 = .39). Grey shaded areas indicate the range (min to max) of left-hander frequencies across the tournaments per year. Note that for 1977 five instead of four tournaments were included since the Australian Open was hold twice in January and December. Percentages of (C) male and (D) female left-handed players in Grand Slam finals per year. Number of different Grand Slam finalists by playing handedness for (E) men and (F) ladies. Filled circles represent left-handed players, triangles represent right-handed players.

