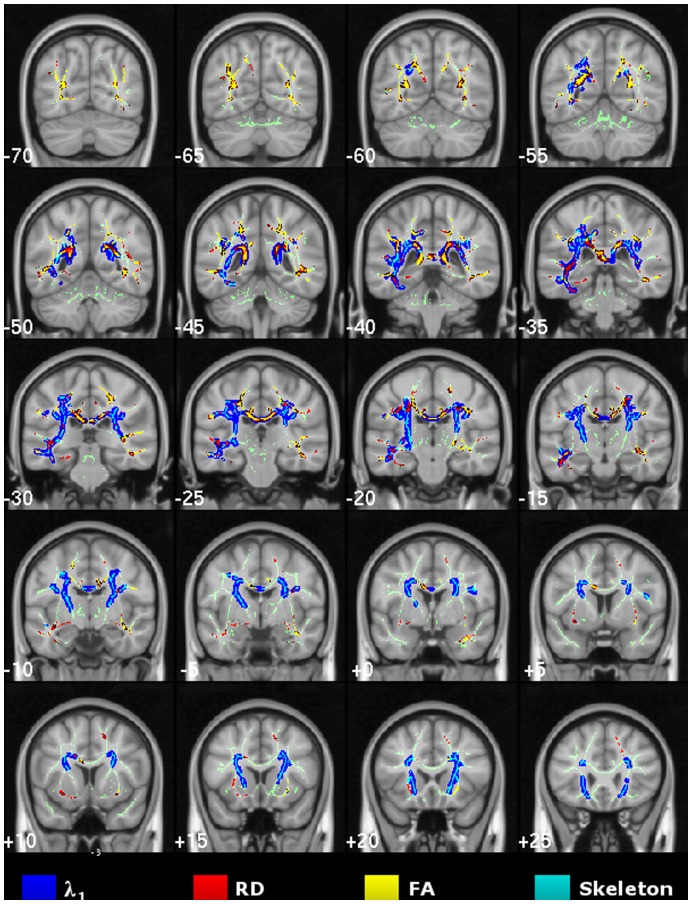
Figure 4. Cross-sectional study of mild Alzheimer’s disease.
TBSS results for the mild-stage Alzheimer’s disease group compared to controls. Thresholded (TFCE-P<0.05) statistical maps for increased axial/radial diffusivity and reduced FA were overlaid onto the mean FA skeleton and the MNI152 template. Coronal depths are given in millimetres.

