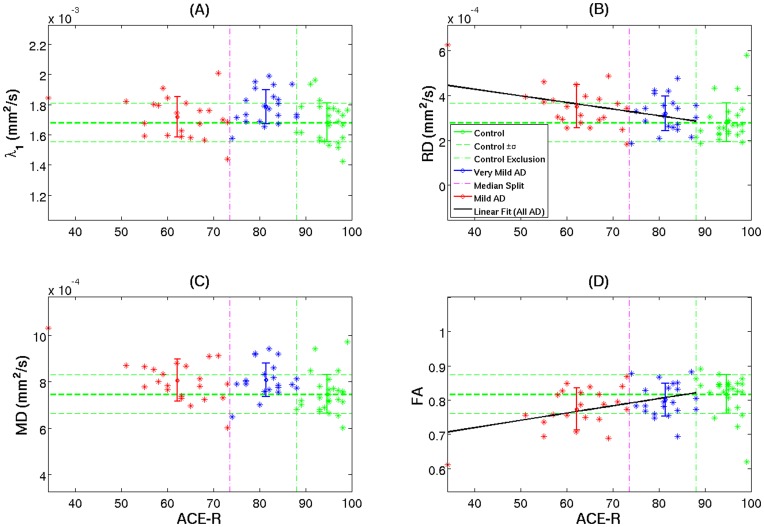
Figure 6. Cross-sectional diffusion tensor behaviour in the splenial region.
Mean subject values for skeletonised DTI parameters in the splenium as a function of cognitive status (ACE-R scores) for controls (green), very mild Alzheimer’s disease (blue) and mild Alzheimer’s disease patients (red). The error bars represent ± one group standard deviation. The vertical axes were scaled to 10 control standard deviations. The vertical lines delimit the control exclusion criteria (ACE-R<88/100) and the median split (ACE-R = 74). A least-square linear fit was displayed if Pearson’s correlation coefficient was deemed statistically significant (Table 4).

