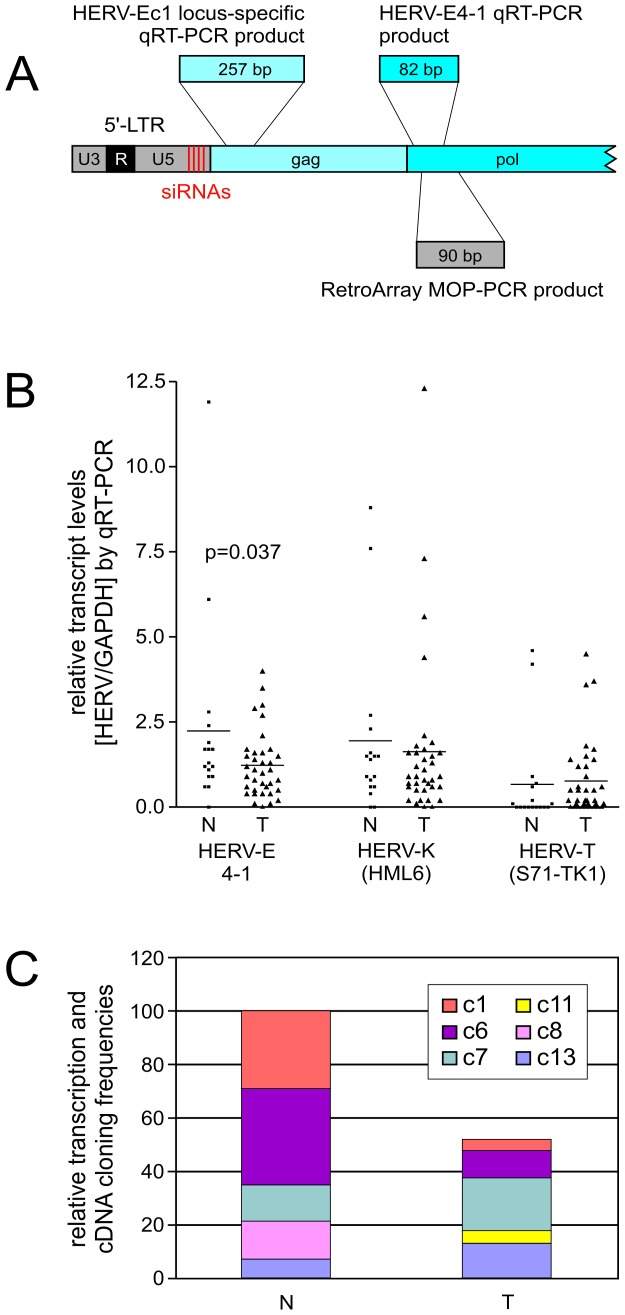
Figure 2. Relative transcript levels of selected HERV elements in patient samples.
(A) Relative positions (not drawn to scale) of siRNAs (red bars) in the HERV-E4-1 5′-LTR. Location and sizes of qRT-PCR and MOP-PCR products (RetroArray) are shown. Given amplicon sizes exclude PCR primers. (B) Quantitative analysis of HERV-E4-1, HERV-K(HML-6) and HERV-T(S71-TK1) transcript levels in cDNA samples derived from 18 non-malignant urothelium (N) and 35 urothelial carcinoma (T) tissue specimen, including 16 paired tissue samples. HERV subgroup-specific pol primers for HERV-E4-1 and HERV-T(S71-TK1), and degenerated pol primers for HERV-K(HML-6) were used. Relative transcript levels were quantified according to Pfaffl [52]. All qRT-PCR values were normalized to GAPDH levels. HERV-E4-1 mean expression of N vs. T was significantly different (p = 0.037; Student’s t-test). (C) Relative cloning frequencies of HERV-E4-1-related cDNAs (as shown in Tab. 3) were combined with the respective HERV-E4-1 qRT-PCR data (Figure 2B) to illustrate the differential activities of transcriptionally active HERV-E4-1 loci in malignant (T) and non-malignant (N) tissues of patient no. 2.

