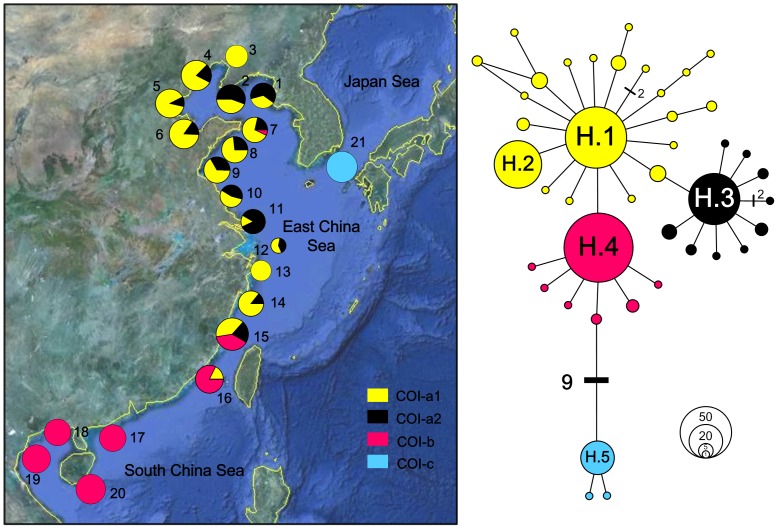
Figure 2. Network and spatial distribution of Cyclina sinensis COI haplotypes.
For the network, two haplogroups representing populations in China and Japan were indicated. The three China sub-haplogroups and one Japan haplogroup are colour-coded separately: yellow, subgroup COI-a1; black, COI-a2; red, COI-b; blue, haplogroup COI-c. The sizes of circles are proportional to haplotype frequencies and are separated by one mutation step, unless otherwise indicated by bars with numbers. Five haplotypes with high frequencies are labelled with H.1 to H.5. The spatial distributions of the subgroups and group are shown in 21 populations (labelled with numbers as shown in Table 1) by pie diagrams.

