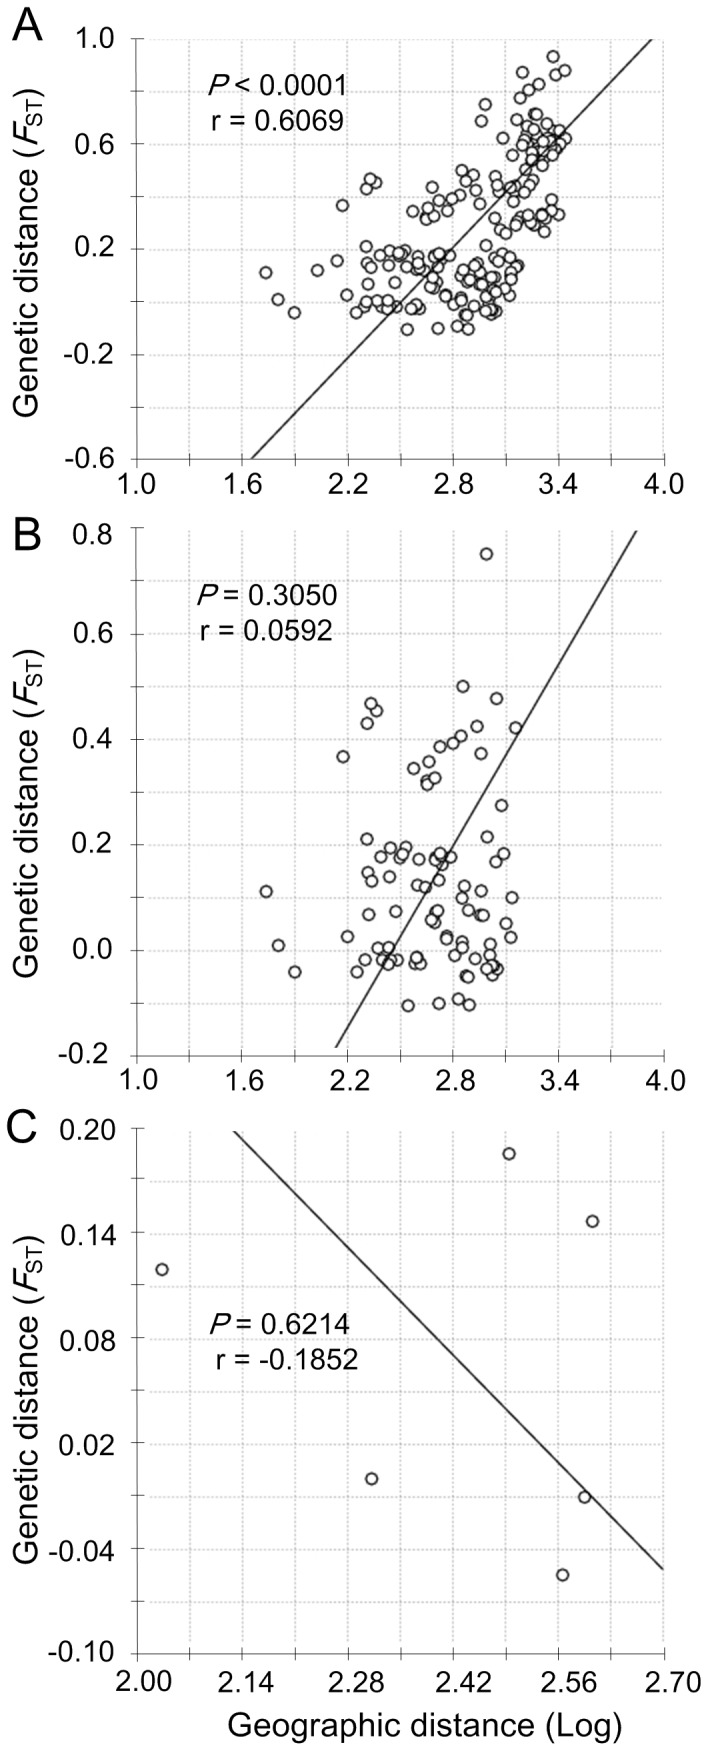
Figure 5. Isolation by distance plots for three grouping of Cyclina sinensis.

Relationship between genetic distance and geographic distance (log-transformed) for (A) all China populations (sites 1–20); (B) the ECS populations (sites 1–14, two hybrid populations 15 and 16 were excluded); (C) the SCS populations (sites 17–20).
