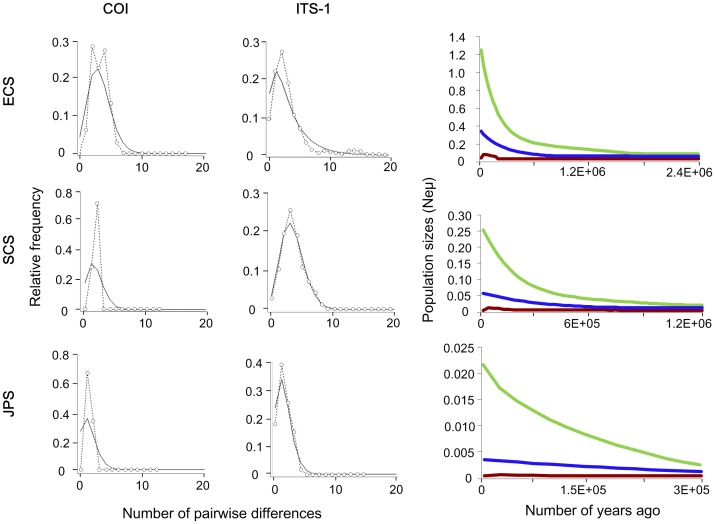
Figure 6. Mismatch distributions and extended Bayesian skyline plots (EBSPs) for three lineages.
In mismatch distributions, dotted lines with circles represent the observed frequency of pairwise differences, whereas the solid lines show the expected values under the sudden population expansion model. The EBSPs show the demographic trends for three lineages as expressed in years. Blue lines represent median population estimates; green and brown lines denote upper and lower 95% confidence intervals.

