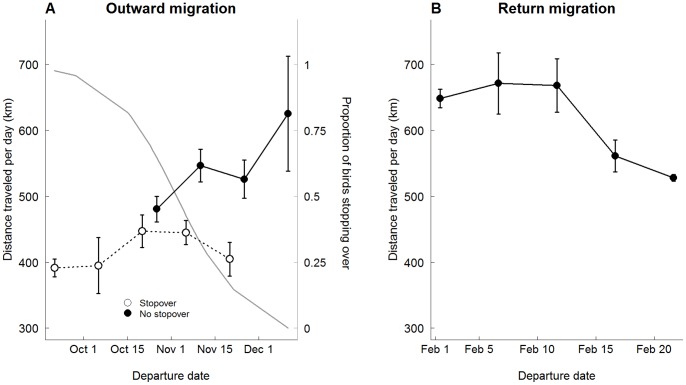
Figure 2. Relationship between departure date and mean (± SE) daily speed during the outward (A) and return (B) migrations.
Open symbols (panel A) represent birds that stopped over (n = 33) and closed symbols birds that did not make stopovers (n = 30). Grey line represents the predicted probability of stopover occurrence considering the departure date from the colony (secondary y-axis; significant negative effect of departure date on the probability of stopping over during the outward migration; slope of the logistic regression = −0.045±0.02; P = 0.03). None of the birds made stopovers during the return migration (panel B; n = 30).

