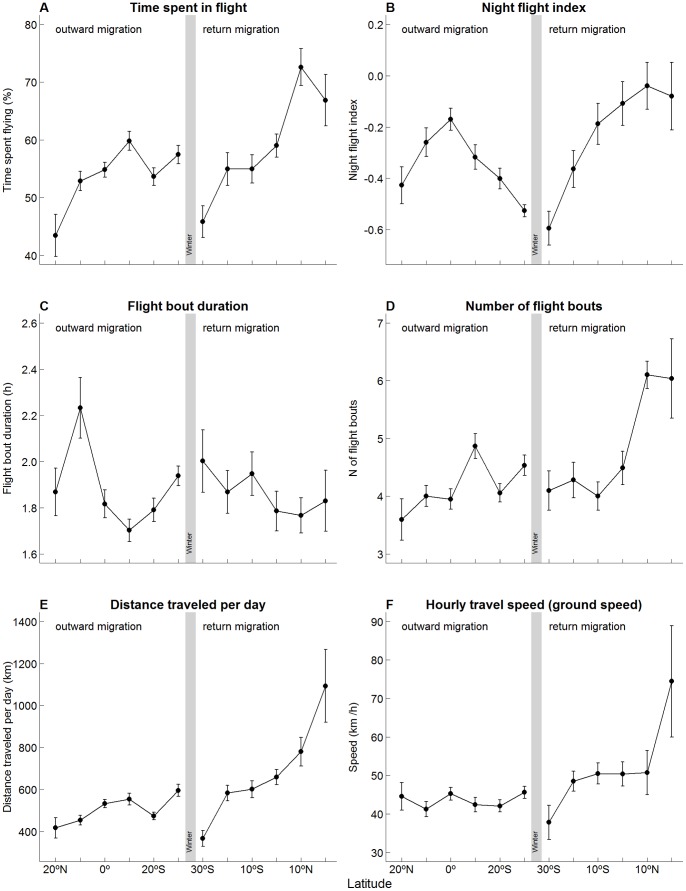
Figure 5. Variation in the flight activity patterns (means ± SE) along the latitude gradients crossed during the outward and return migrations.
Note that latitude values (x-axis) varies southwards first (outward migration), and northwards after the grey bar (that represents the winter area), thus mirroring the temporal order at which the birds crossed each latitude.

