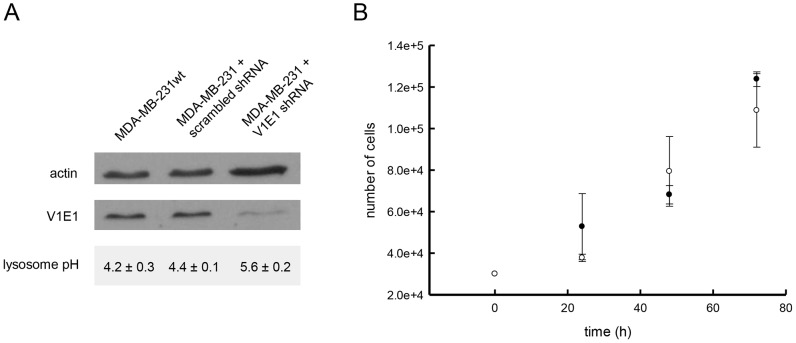
Figure 4. Characterization of MDA-MB-231 cells with reduced V-H+-ATPase subunit V1E1 expression and increased lysosomal pH.
A. Western blot analysis of the V1E1 subunit expression is shown along with the actin loading control. Experimentally determined lysosomal pH values in untreated, scrambled shRNA- and V1E1 shRNA-treated cells is shown (values represent the mean±s.d., n = 3) B. V-ATPase subunit knockdown does not alter the growth rate of MDA-MB 231 cells. The filled circles represent cells treated with the scrambled shRNA vector and the open circles represent cells treated with the V-ATPase V1E1 shRNA. Cells were plated at a density of 3×10⁵ cells/well on a 6-well plate and were trypsinized, counted and replated every 24 hours for 3 days (data points represent the mean±s.d, n = 3).

