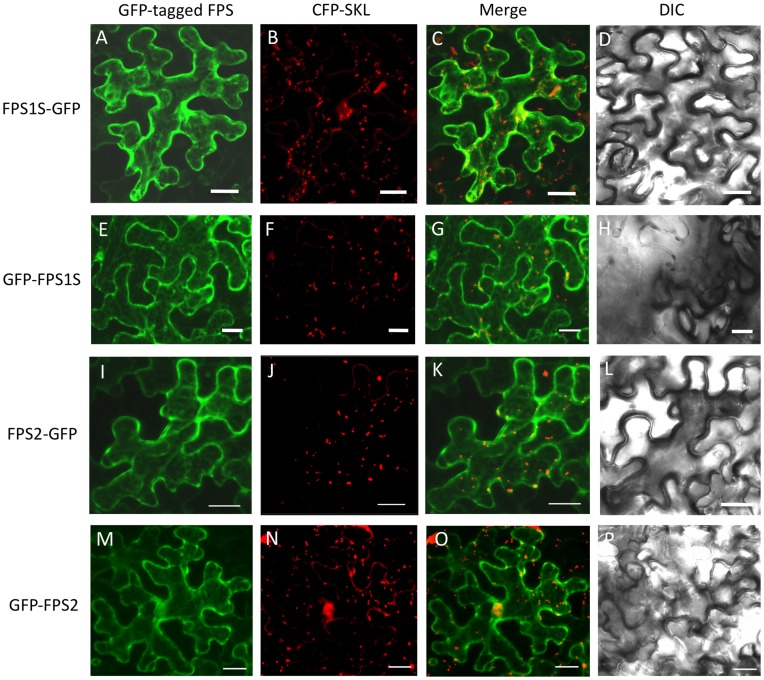
Figure 5. Subcellular localization of GFP-tagged FPS1S and FPS2 proteins.
Confocal laser scanning micrographs showing the distribution of fluorescence in agroinfiltrated N. benthamiana epidermal cells transiently co-expressing FPS1S-GFP (A), GFP-FPS1S (E), FPS2-GFP (I) or GFP-FPS2 (M) with the peroxisome protein marker CFP-SKL (B, F, J and N). Co-localization evaluation of GFP-tagged FPS proteins with the peroxisome protein marker (C, G, K and O). Differential interference contrast (DIC) images showing the morphology of transformed cells (D, H, L and P). Scale bars = 20 µm.

