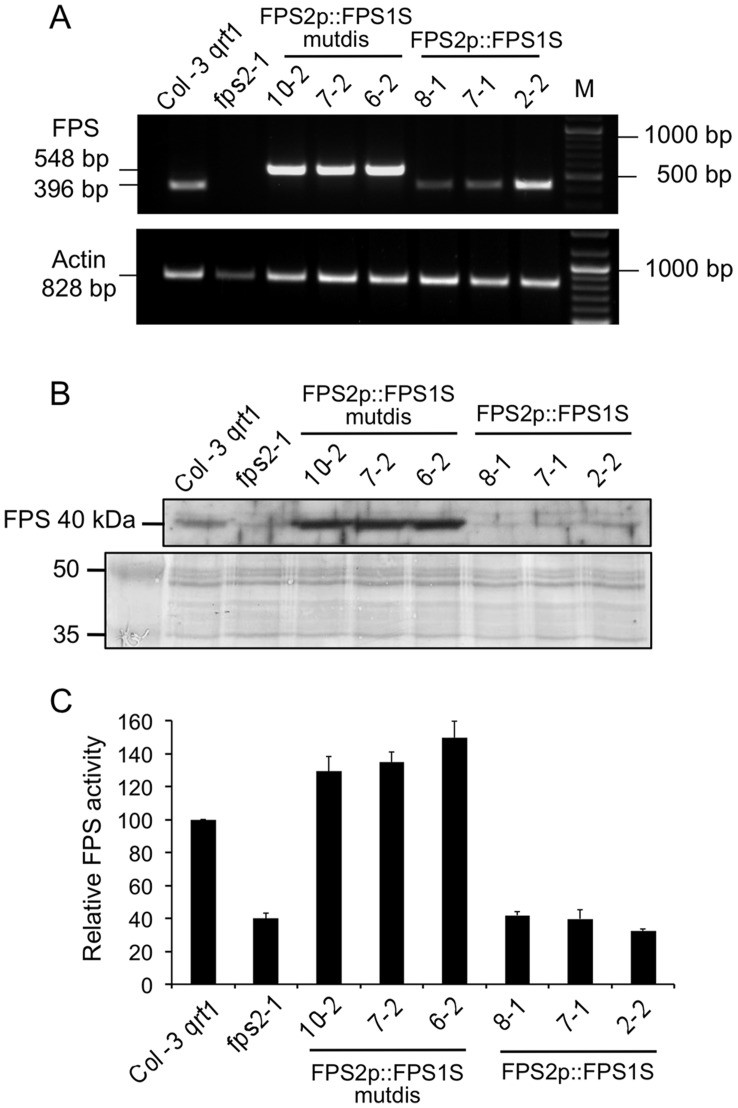
Figure 8. Characterization of fps2-1 mutant lines harbouring FPS2p::FPS1S and FPS2p::FPS1-mutdis genes.
(A) The expression of FPS2p::FPS1S and FPS2p::FPS1-mutdis was investigated using total RNA from 12-day-old seedlings of Arabidopsis wild-type, fps2-1 and the indicated lines of the fps2-1 mutant harbouring FPS2p::FPS1S-mutdis and FPS2p::FPS1S chimeric genes (upper panel). PCR products were electrophoresed in a 1% agarose gel. The size in bp of the amplified cDNA fragments corresponding to FPS2p::FPS1-mutdis, FPS2p::FPS1S and ACT2 (actin) genes is indicated on the left. The size of the fragment amplified from FPS2p::FPS1S-mutdis lines (548 bp) was larger than that amplified from both FPS2p::FPS1S lines and wild-type plants (396 bp) because the FPS2::FPS1-mutdis mRNA contains the region between the two ATG translation start codons of the FPS1 gene, which is not present in the FPS2::FPS1S mRNA. Numbers on the right indicate the sizes in bp of DNA markers shown in lane M. (B) Western blot analysis of total FPS protein in 16,000 g extracts from seeds of plant lines indicated above (upper panel). The lower panel shows the Coomassie blue-stained electrophoretic protein patterns in the 35 to 50 kDa range of extracts used for FPS protein level determinations. Images show the results of one representative experiment. (C) FPS activity in the 16,000 g protein extracts used for Western blot analysis. FPS activity in fps mutants is expressed relative to that in the wild-type, which was assigned a value of 100. The mean values and SE were calculated from three independent experiments.

