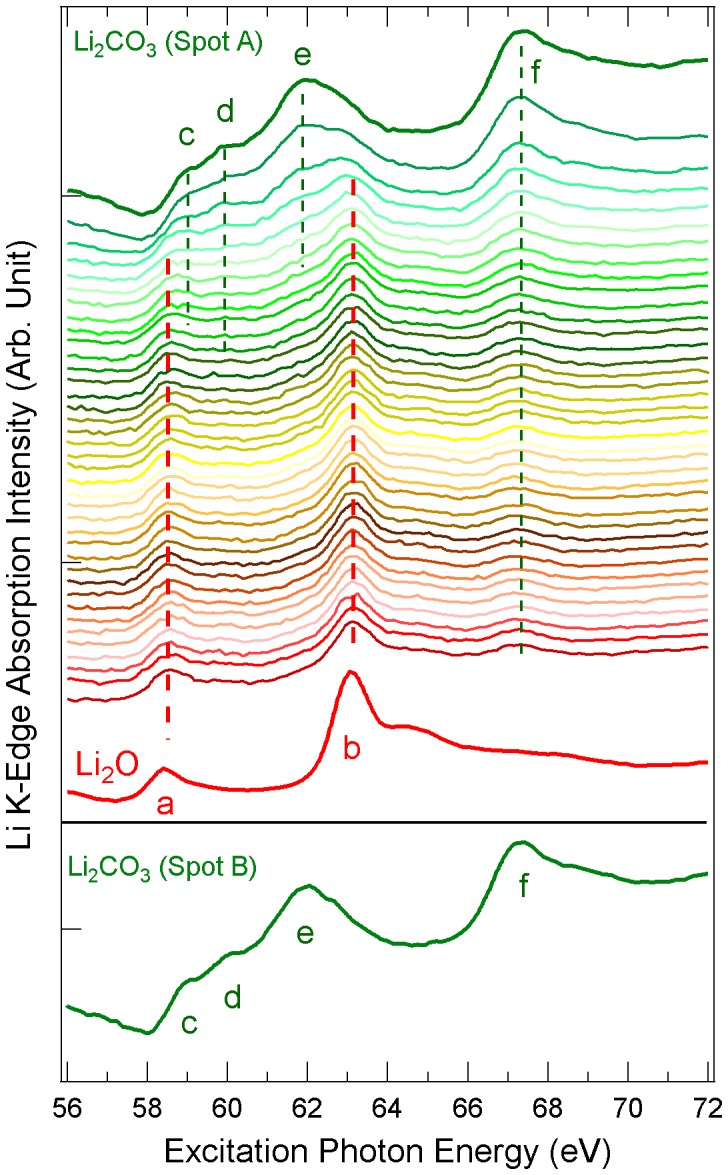
Figure 5. Soft x-ray irradiation effect on Li2CO3 revealed by Li K-edge XAS spectra.

The XAS lineshape of Li2CO3 (from top to bottom) evolve towards that of Li2O (red) after exposed to the soft x-rays. Each spectrum was taken with 10 minute x-ray exposure. The bottom panel shows the Li2CO3 Li K-edge XAS spectrum collected from a new spot B on the same sample.
