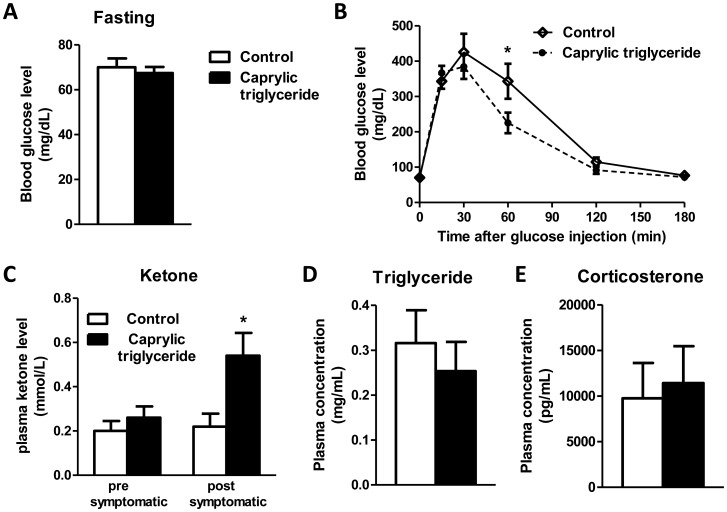
Figure 3. Glucose tolerance, ketone, triglyceride and corticosterone levels following caprylic triglyceride treatment.
(A) Fasting serum glucose level and (B) glucose tolerance test in SOD1-G93A animals on control or caprylic triglyceride; (C) Blood ketone level at pre-symptomatic (10 weeks) or post-symptomatic (17 weeks) stage; (D) Plasma total triglyceride levels. (E) Plasma corticosterone level. All data are mean ± SEM, n = 4–5 for (A, B), n = 5 for (C) and n = 6–7 for (D, E) *p<0.05 by two-tailed t-test).

