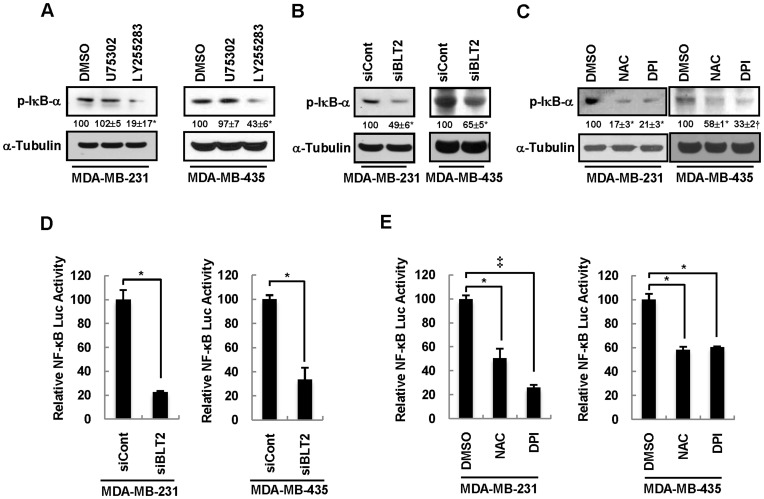
Figure 5. NF-κB is activated downstream of the BLT2-Nox1-ROS signaling pathway.
(A–C) MDA-MB-231 and MDA-MB-435 cells were incubated with U75302 (1 µM), LY255283 (10 µM), or DMSO vehicle for 6 h (A), were transfected with BLT2 or control siRNAs for 48 h (B), or were incubated with NAC (5 mM), DPI (0.5 µM), or DMSO for 6 h (C). Cell lysates were then subjected to immunoblot analysis with antibodies to phosphorylated IκB-α (p-IκB-α) and to α-tubulin (loading control). Numbers under lanes indicate relative density of p-IκB-α from three independent experiments. (D and E) MDA-MB-231 and MDA-MB-435 cells were transiently transfected with control or BLT2 siRNAs and the pNF-κB-Luc reporter plasmid for 24 h, deprived of serum for 12 h, and then harvested (D). Alternatively, the cells were transiently transfected with pNF-κB-Luc, incubated with NAC (5 mM), DPI (0.5 µM), or DMSO for 6 h, and harvested (E). All cells were then assayed for relative luciferase activity. Data are expressed relative to the corresponding control value and are means±SD from three independent experiments. *P<0.05, †P<0.01, ‡P<0.005.

