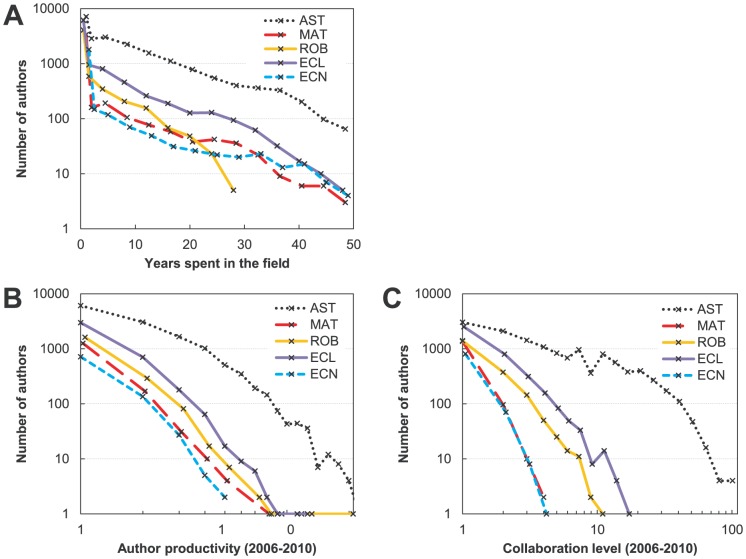
Figure 1. Distributions of authors of different academic age (A), recent productivity (B), and collaboration level (C).
Note the logarithmic scale on the y axis and on the x axis for productivity and collaboration. Highest bins in every category contain very few authors. Distribution of the academic age (panel A) is per bin, and uses 4-year bins beyond year two. First bin (x = 1) in panel A is higher for all fields because it contains transient authors who appear with only one publication. Decline is approximately exponential in A and power-law in B and C.

