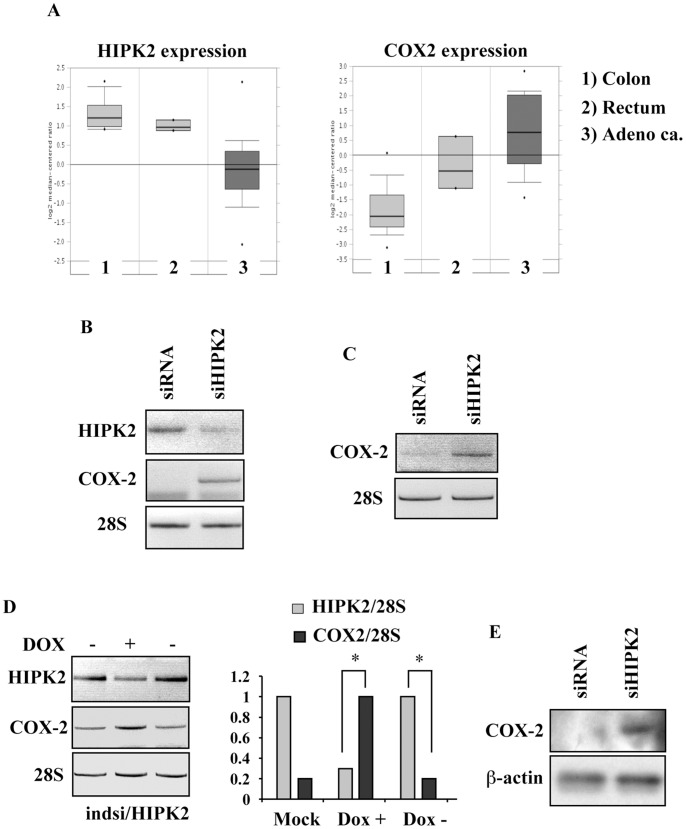
Figure 1. Inverse correlation between low HIPK2 and high COX-2 expression levels in cancer cells.
(A) HIPK2 and COX-2 gene expression profile in primary tumors. The box plots represent HIPK2 (left panel) and COX-2 (right panel) mRNA levels in specimens of 1) colon, 2) rectum, and 3) colon adenocarcinoma primary tumors. *P<0.001. (B) Semi-quantitative RT-PCR analyses of HIPK2 and COX-2 gene expression in RKO cells stably interfered for HIPK2 function (siHIPK2) or with non-target RNA interference (siRNA). 28S was used as internal control. (C) Representative RT-PCR analysis of HCT116 cells transfected with pSuper-HIPK2 (siHIPK2) or pSuper control (siRNA) vector for 48 h. 28S was used as internal control. (D, left panel) Representative RT-PCR analyses of MCF7-indsi/HIPK2 cells treated with Dox (DOX+) for 5 days (for HIPK2 knockdown) and then cultured without Dox (DOX-) for additional 5 days (for HIPK2 recovery). (D, right panel) Densitometric analysis of HIPK2 and COX-2 levels (as in the left panel) was performed and normalized values to 28S mRNA levels were plotted. *P = 0.001. (E) Total cell extracts from RKOsiHIPK2 and control siRNA cells were analysed by Western immunoblotting to assess COX-2 protein levels. β-actin was used as protein loading control.

