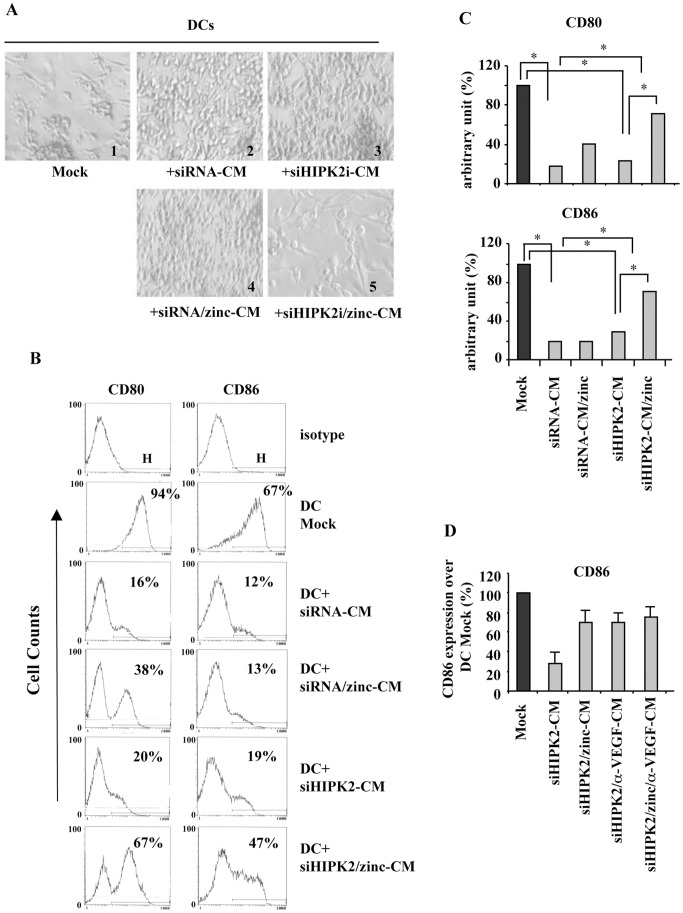
Figure 5. Inhibition/reactivation of DCs maturation cultured with conditioned media (CM) of siRNA control or HIPK2 depleted cells with or withour zinc treatment.
(A) Light microscopy showing control differentiated DCs (Mock, panel 1) and inhibition of differentiated DCs morphology in the presence of CM of siRNA control (panel 2) or HIPK2 depleted cells (siHIPK2) (panel 3); this inhibition did not take place only if DCs where cultured in the presence of CM of zinc-treated siHIPK2-CM (panel 5) compared to CM of zinc-treated siRNA control cells (panel 4). One representative experiment out of three independent experiments was shown. Microphotograph magnification, 10×. (B) Analysis of surface DCs maturation markers, CD80 and CD86, using flow cytometry. DC Mock: control mature DCs; DC+siRNA-CM: DCs maturation in the presence of CM of siRNA control cells; DC+siHIPK2-CM: DCs maturation in the presence of CM of HIPK2 depleted cells (siHIPK2); DC+siRNA/zinc-CM: DCs maturation in the presence of zinc-treated siRNA cells; DC+siHIPK2/zinc-CM: DCs maturation in the presence of CM of zinc-treated siHIPK2 cells. A representative experiment, out of three, is shown. The isotype control is shown. H indicates the region used to calculate the % of positive cells for each costimulatory molecule, for each sample. (C) Percentage of CD80 and CD86 expression in DCs cultured with the indicated CM as in (B) and compared to control mature DCs fixed at 100%. (D) Analysis of surface DCs maturation marker CD86 using flow cytometry. The results are expressed as percentage (%) ±S.D., over DC Mock fixed at 100%. Mock: control mature DCs; siHIPK2-CM: DCs maturation in the presence of CM of HIPK2 depleted cells (siHIPK2); siHIPK2/zinc-CM: DCs maturation in the presence of CM of zinc-treated siHIPK2 cells; siHIPK2/α-VEGF-CM: DCs maturation in the presence of CM of α-VEGF-treated HIPK2 depleted cells; siHIPK2/zinc/α-VEGF-CM: DCs maturation in the presence of CM of zinc- and α-VEGF-treated HIPK2 depleted cells.

