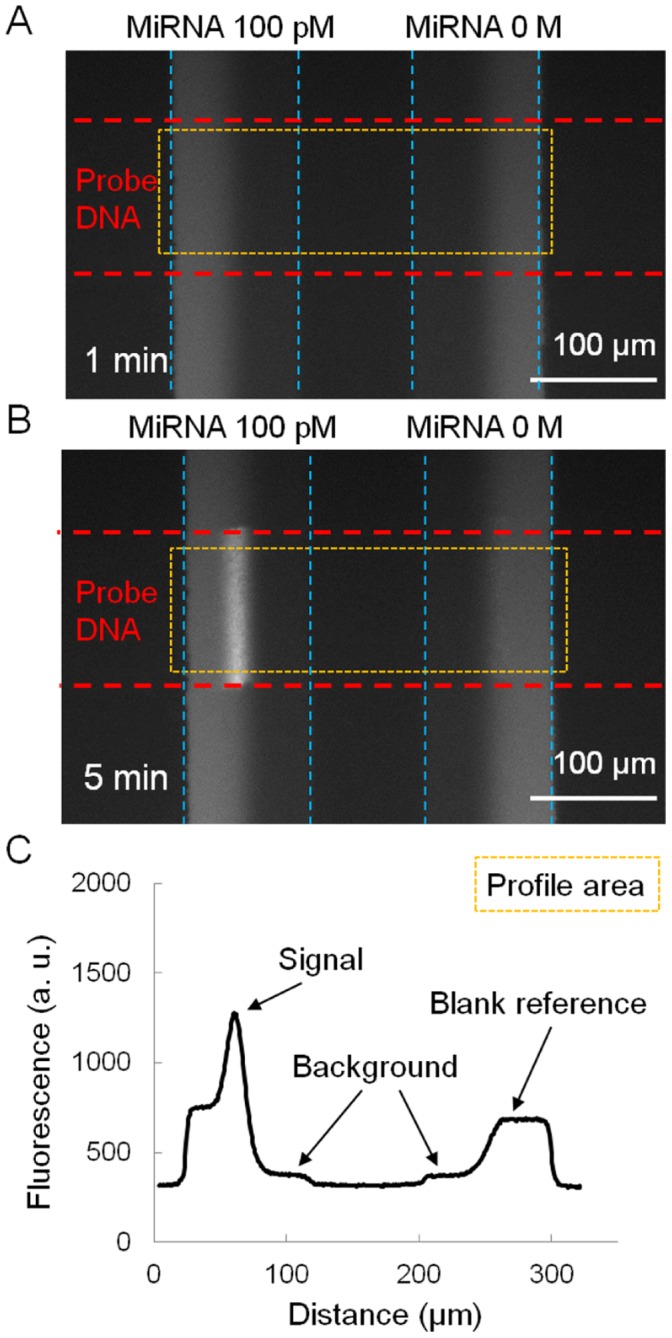
Figure 3. Fluorescent signals and their profiles.

(A) Microscopic view of a fluorescent signal at an elapsed time of 1 min of LFDA. (B) Microscopic view of an amplified fluorescent signal at an elapsed time of 5 min of LFDA. The dendritic amplification is a three-phase reaction that takes place only at the intersection between the probe DNA patterned surface and the interface of the laminar flow. (C) Profile of the fluorescent intensity at an elapsed time of 5 min. In LFDA, the fluorescent signal appears in line. We defined the peak intensity in the left channel from the background level as the signal. Similarly, the maximum intensity in the right channel, which is indistinguishable from the fluorescence of bulk F-SA flow in this figure, was used as the blank reference.
