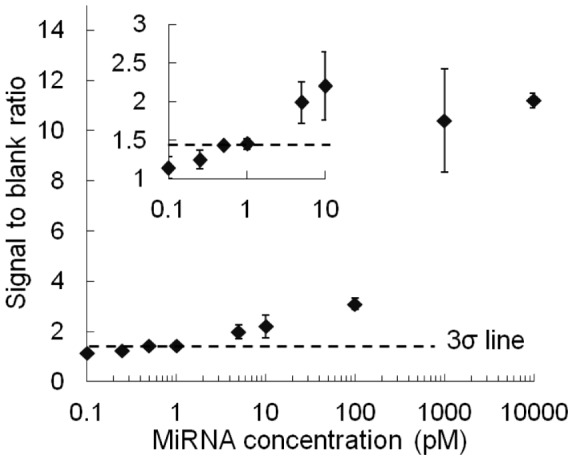
Figure 5. Signal to blank ratio vs. miRNA concentration.

The inset shows an expanded view at low concentrations. The error bars represent standard deviations (n = 3). The “3σ line” was used for calculation of the LOD. This line was drawn at the position 3σ higher than the y-intercept of the fitting curve, where σ denotes the standard deviation of zero-concentration data (n = 5).
